Fig. 8.
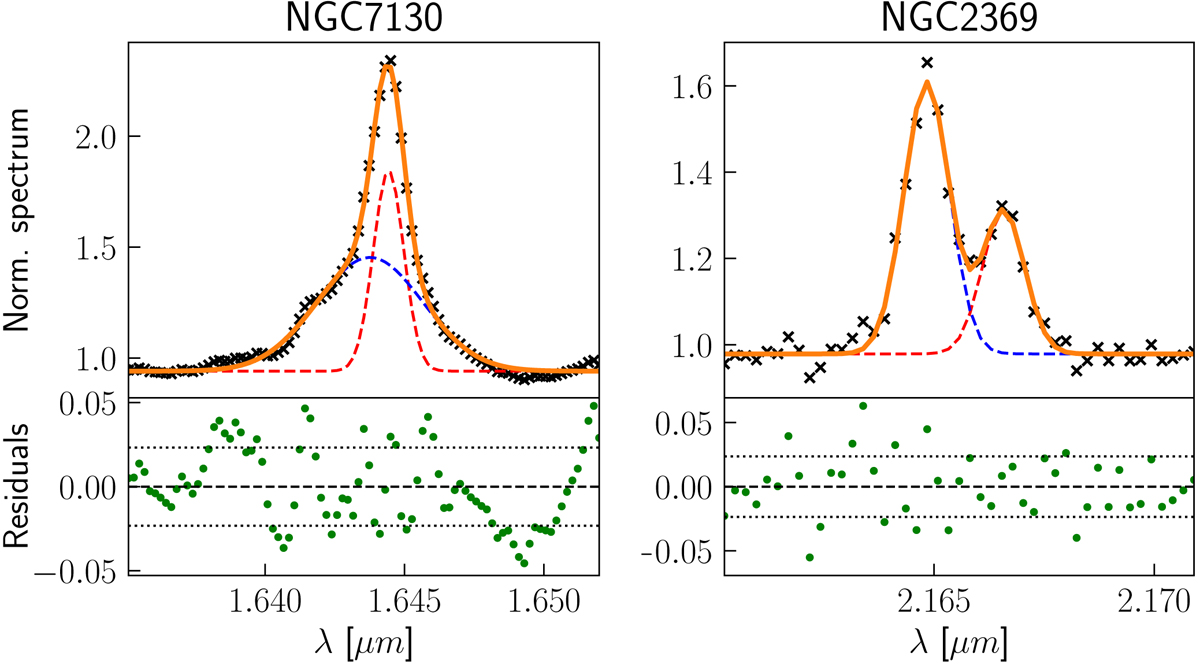
Double-Gaussian profile fits. Line decomposition using a double-Gaussian profile for [Fe II] in NGC 7130 (left panel) and Brγ in NGC 2369 (right panel). Normalised spectra are shown as black crosses, while the fitted components and their sum are displayed in blue, red, and orange, respectively. Residuals are shown as green dots in the bottom panels. Dotted horizontal lines represent the 1σ value of the residuals.
Current usage metrics show cumulative count of Article Views (full-text article views including HTML views, PDF and ePub downloads, according to the available data) and Abstracts Views on Vision4Press platform.
Data correspond to usage on the plateform after 2015. The current usage metrics is available 48-96 hours after online publication and is updated daily on week days.
Initial download of the metrics may take a while.