Fig. D.1.
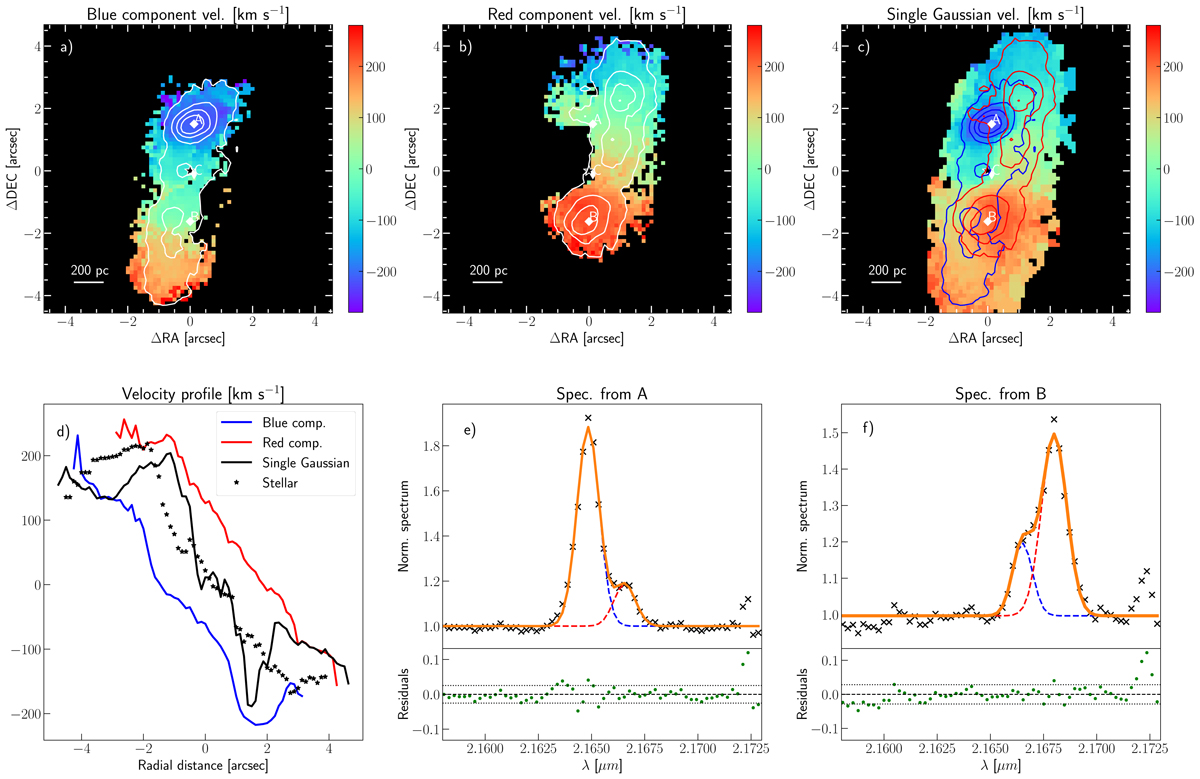
Double-Gaussian analysis in NGC 2369. Panels a and b: velocity of the blue and red components derived from the Brγ analysis. White contours represent the flux of each component. White diamonds, labelled A, B, and C, represent the flux peak of the blue and red component, and their midpoint, respectively. Black star represents the kinematic centre derived with DiskFit. Panel c: velocity derived from the single-Gaussian fit carried out in Piqueras López et al. (2012). Blue and red contours represent the flux contours of each component. Panel d: observed velocity curves extracted using the ‘C’ point and the PA from Table 3. Red, blue, and black solid lines represent the velocity from panels a, b, and c, respectively. Stars represent the stellar velocity curve extracted from the H-band and presented in Fig. C.1. Panels e and f: double-Gaussian fits of the spectra corresponding to the flux peaks of each component (labelled A and B in the top panels, respectively). Black crosses represent the original spectra, whereas both components and the total fit are displayed by dashed blue and red, and solid orange lines, respectively. Green dots in the lower panels show the residuals of the fit.
Current usage metrics show cumulative count of Article Views (full-text article views including HTML views, PDF and ePub downloads, according to the available data) and Abstracts Views on Vision4Press platform.
Data correspond to usage on the plateform after 2015. The current usage metrics is available 48-96 hours after online publication and is updated daily on week days.
Initial download of the metrics may take a while.