Fig. 3.
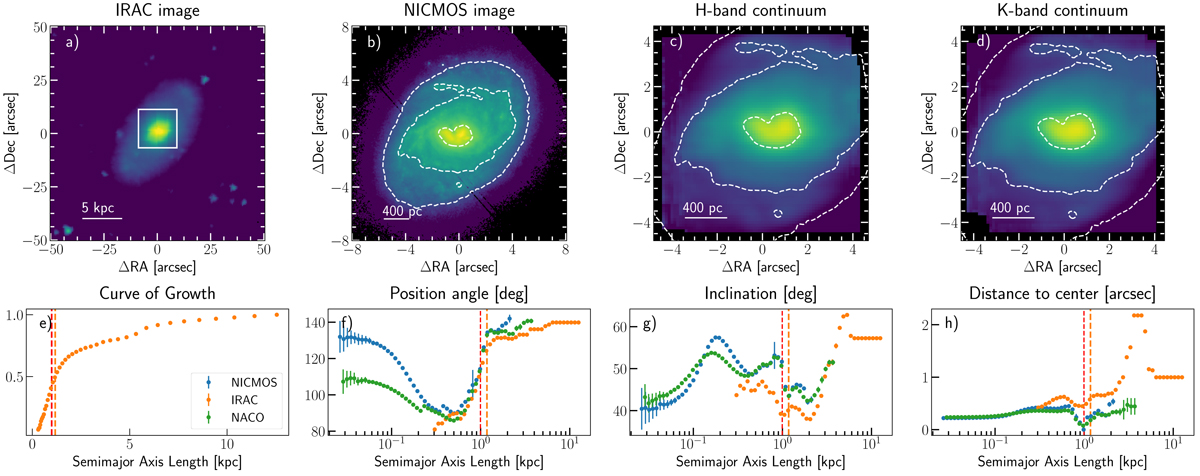
Photometric analysis for ESO 320-G030. Panels a and b: Spitzer/IRAC and HST/NICMOS images used in this work, respectively. The white square in panel a represents the FoV displayed on the panel b. Panels c and d: H- and K-band SINFONI continuum maps used during the alignment (see Sect. 3.2). Panel e: curve-of-growth obtained from the IRAC image. Panels f and g: radial profiles of the PA and inclination with the size of the elliptical aperture. Panel h: radial profile of the photo-centre, expressed as the distance from the centre at Rr. Vertical dashed lines in the lower panels represent the aperture associated to the effective radius extracted with the CoG method for each image. Red dashed line marks the Rr aperture, at which the parameters are extracted (see Table 3).
Current usage metrics show cumulative count of Article Views (full-text article views including HTML views, PDF and ePub downloads, according to the available data) and Abstracts Views on Vision4Press platform.
Data correspond to usage on the plateform after 2015. The current usage metrics is available 48-96 hours after online publication and is updated daily on week days.
Initial download of the metrics may take a while.