Fig. 7.
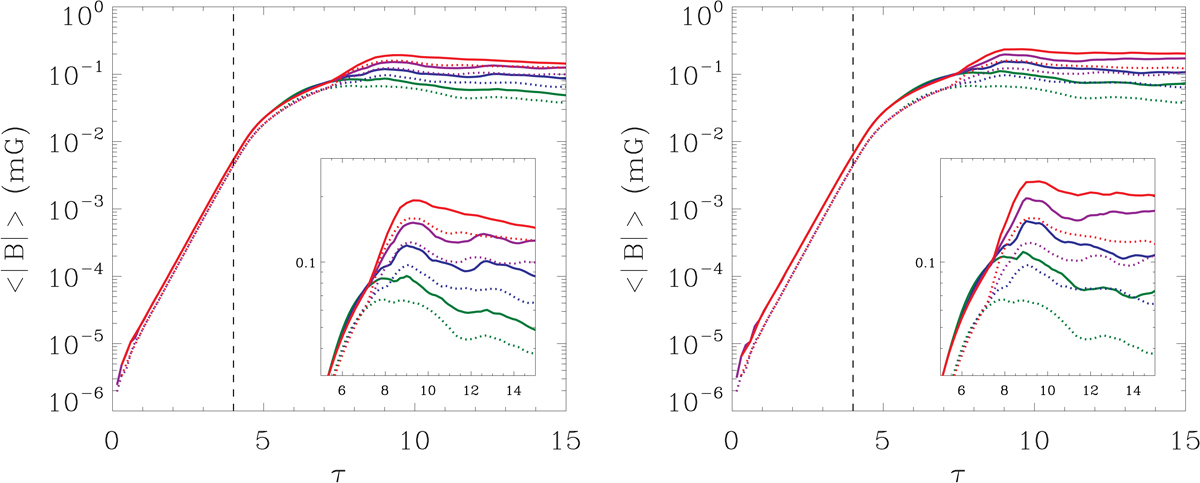
Averaged magnetic field as a function of time and resolution for the cases with χc = 0.5 (left) and χc = 0.1 (right). Solid lines represent simulations in which the ion-neutral collisional interaction is taken into account (without charge-exchange). Dotted lines represent simulations without collisional coupling. Green, blue, purple, and red colours correspond to simulations with N0 = 250, 500, 1000, 2000, respectively. The vertical dashed lines approximately mark the separation between the linear and non-linear phases of the instability. The inset in each panel shows a zoom of the interval τ ∈ [5, 15].
Current usage metrics show cumulative count of Article Views (full-text article views including HTML views, PDF and ePub downloads, according to the available data) and Abstracts Views on Vision4Press platform.
Data correspond to usage on the plateform after 2015. The current usage metrics is available 48-96 hours after online publication and is updated daily on week days.
Initial download of the metrics may take a while.