Free Access
Fig. 4.
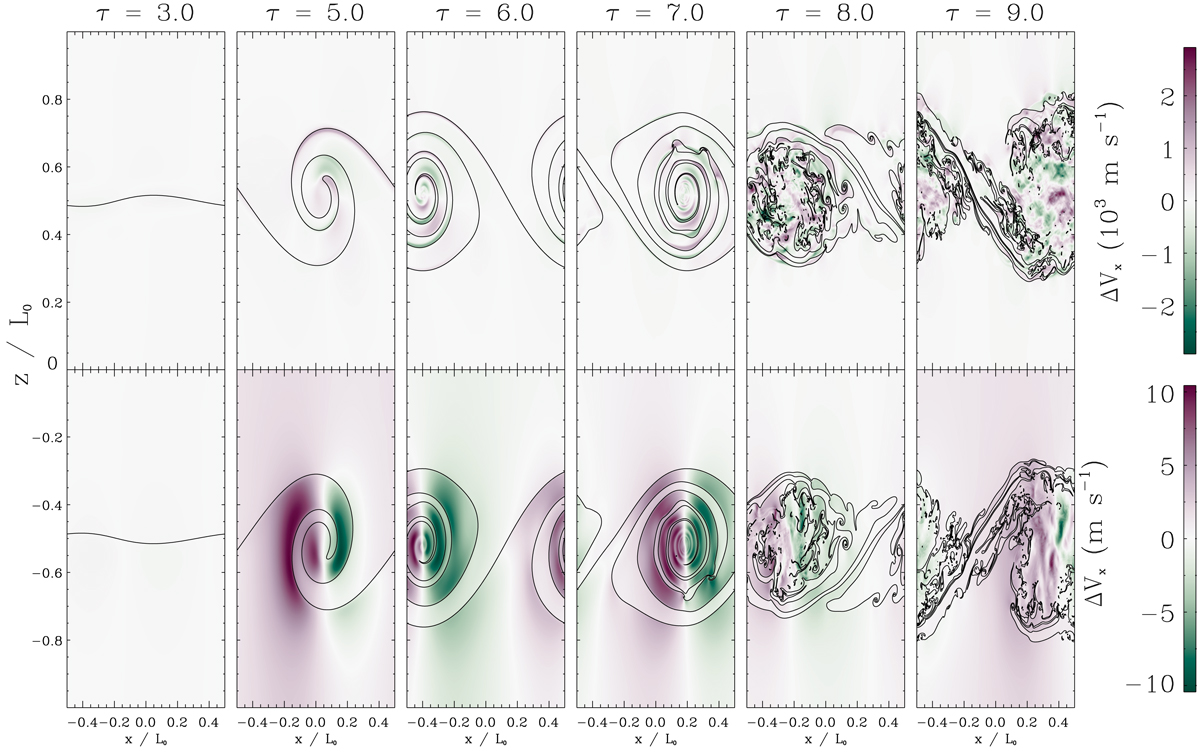
Velocity drifts, ΔVx ≡ Vx,c − Vx,n, for the same simulations as in Fig. 3. The black lines represent density iso-contours. We note that the units of the top colourbar are km s−1 and the units of the bottom colourbar are m s−1: the presence of the collisional coupling reduces the magnitude of the velocity drifts.
Current usage metrics show cumulative count of Article Views (full-text article views including HTML views, PDF and ePub downloads, according to the available data) and Abstracts Views on Vision4Press platform.
Data correspond to usage on the plateform after 2015. The current usage metrics is available 48-96 hours after online publication and is updated daily on week days.
Initial download of the metrics may take a while.