Fig. 2.
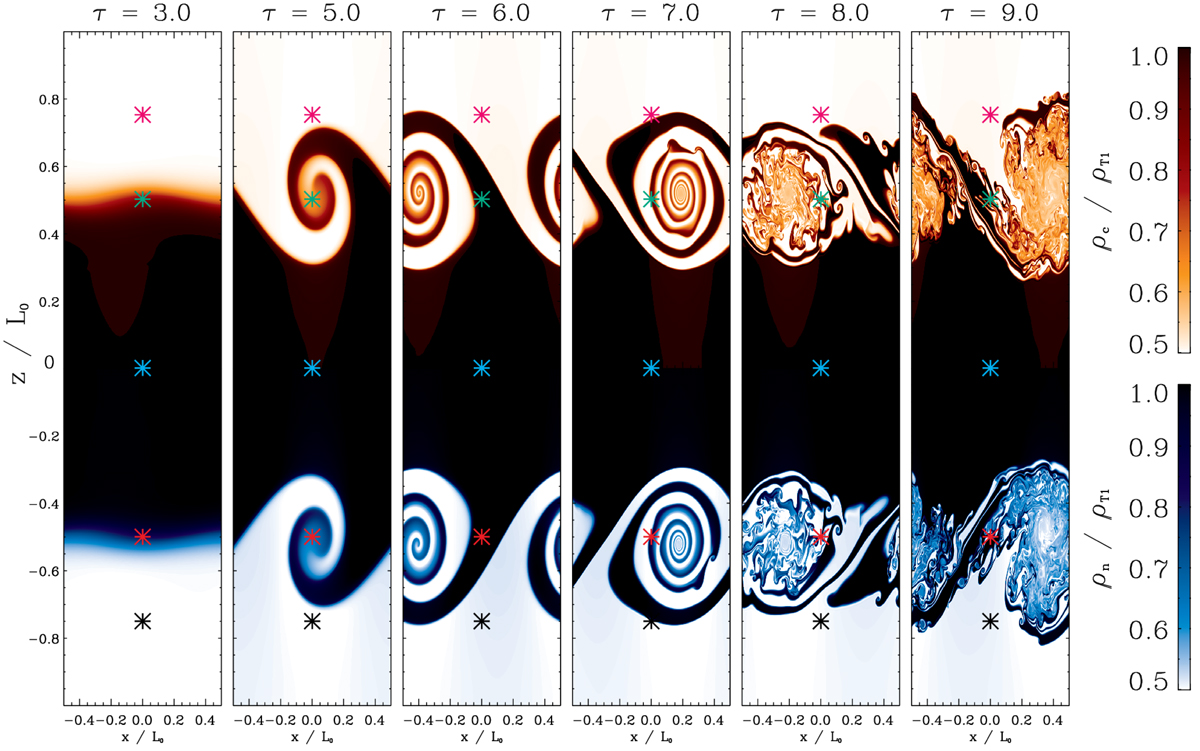
Density snapshots of a simulation with χc = 0.5 with no coupling between the charged (orange top half) and neutral (blue bottom half) fluids. Time is measured in the units of τ ≡ t/t0, where t0 ≡ L0/U0 is the domain crossing time. Asterisks represent key points whose temporal evolution is analysed in Sect. 3.1.3. An animation of this figure is available online.
Current usage metrics show cumulative count of Article Views (full-text article views including HTML views, PDF and ePub downloads, according to the available data) and Abstracts Views on Vision4Press platform.
Data correspond to usage on the plateform after 2015. The current usage metrics is available 48-96 hours after online publication and is updated daily on week days.
Initial download of the metrics may take a while.