Fig. A.1.
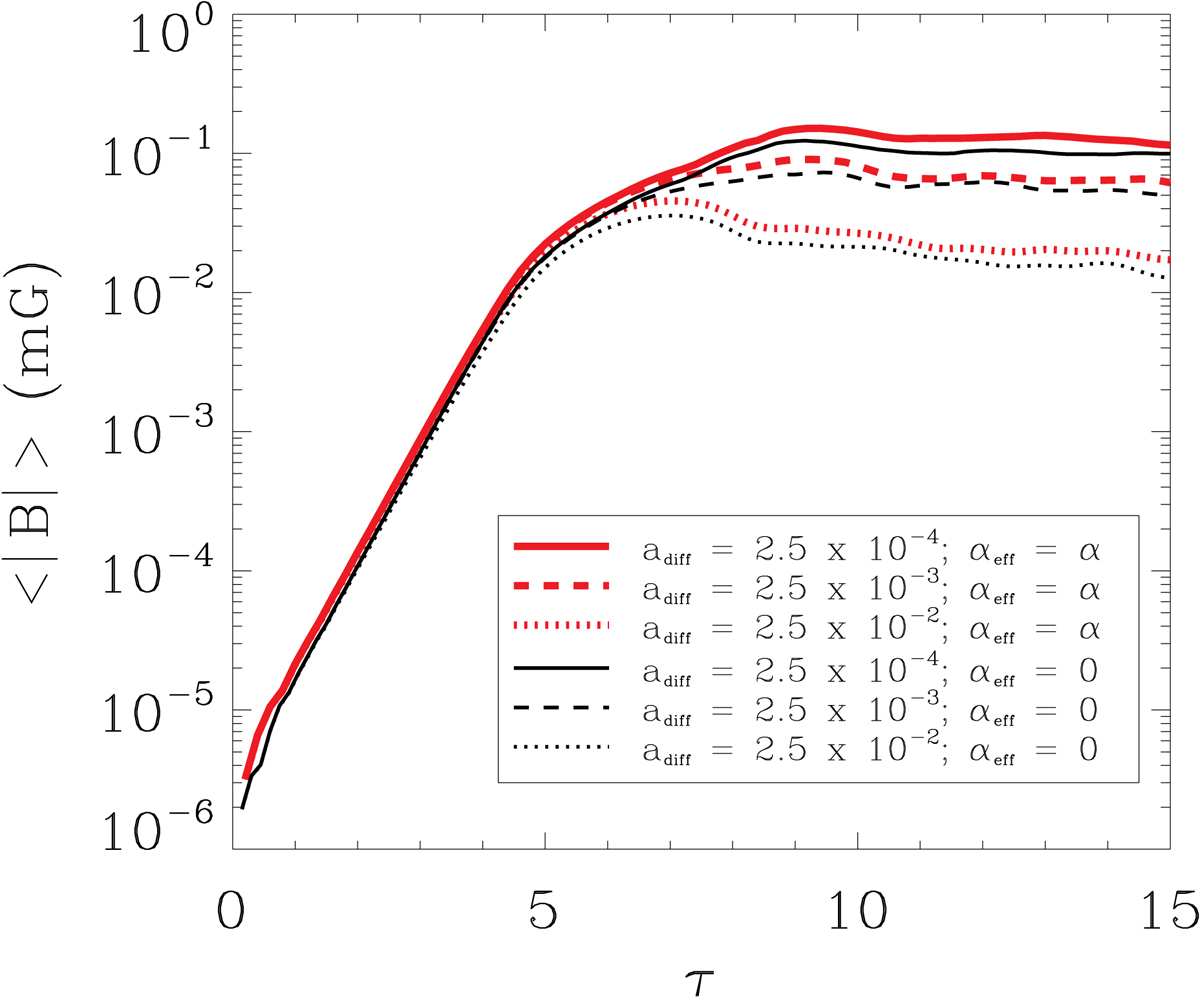
Mean magnetic field as a function of time and numerical diffusivity for the case with χc = 0.5. The solid line represents a simulation with adiff = 2.5 × 10⁻⁴ (in normalised units) while the dashed and the dotted lines correspond to simulations with adiff = 2.5 × 10⁻³ and adiff = 2.5 × 10⁻², respectively. Black and red lines represent the cases with αeff = 0 and αeff = α.
Current usage metrics show cumulative count of Article Views (full-text article views including HTML views, PDF and ePub downloads, according to the available data) and Abstracts Views on Vision4Press platform.
Data correspond to usage on the plateform after 2015. The current usage metrics is available 48-96 hours after online publication and is updated daily on week days.
Initial download of the metrics may take a while.