Fig. 11.
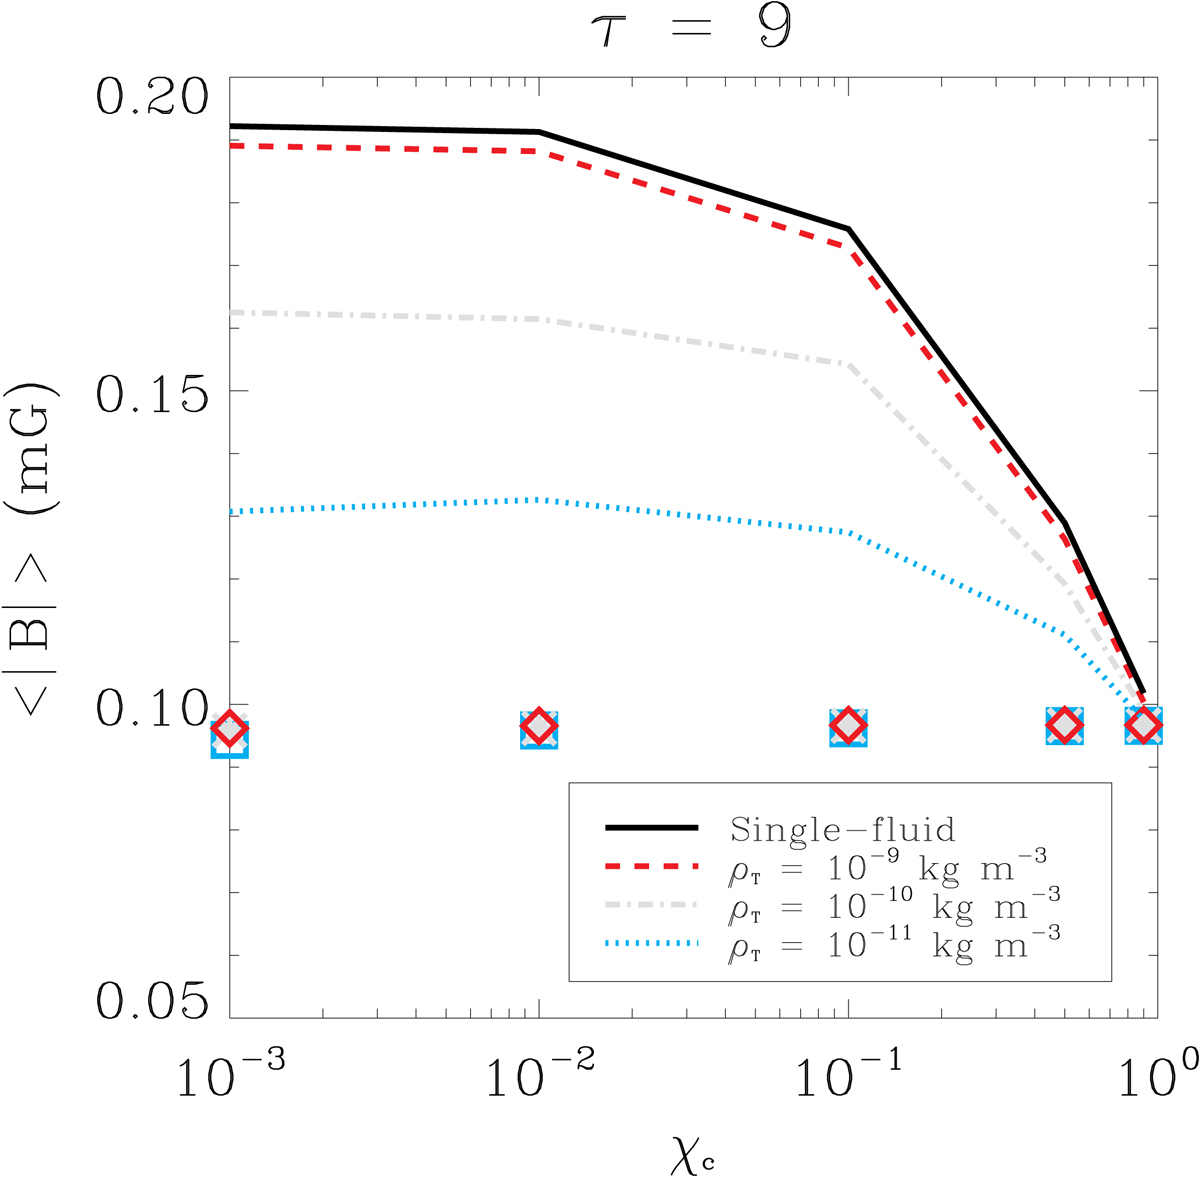
Spatially averaged magnetic field as a function of ionisation degree for simulations with N0 = 500 and different values of total density, ρT. Symbols and lines correspond to simulations with αeff = 0 and αeff = α, respectively. The blue dotted, grey dashed-dotted, and red dashed lines represent the cases with ρT = 10−11, 10−10 and 10−9 kg m−3, respectively. The black line corresponds to the prediction of the single-fluid model.
Current usage metrics show cumulative count of Article Views (full-text article views including HTML views, PDF and ePub downloads, according to the available data) and Abstracts Views on Vision4Press platform.
Data correspond to usage on the plateform after 2015. The current usage metrics is available 48-96 hours after online publication and is updated daily on week days.
Initial download of the metrics may take a while.