Fig. 8.
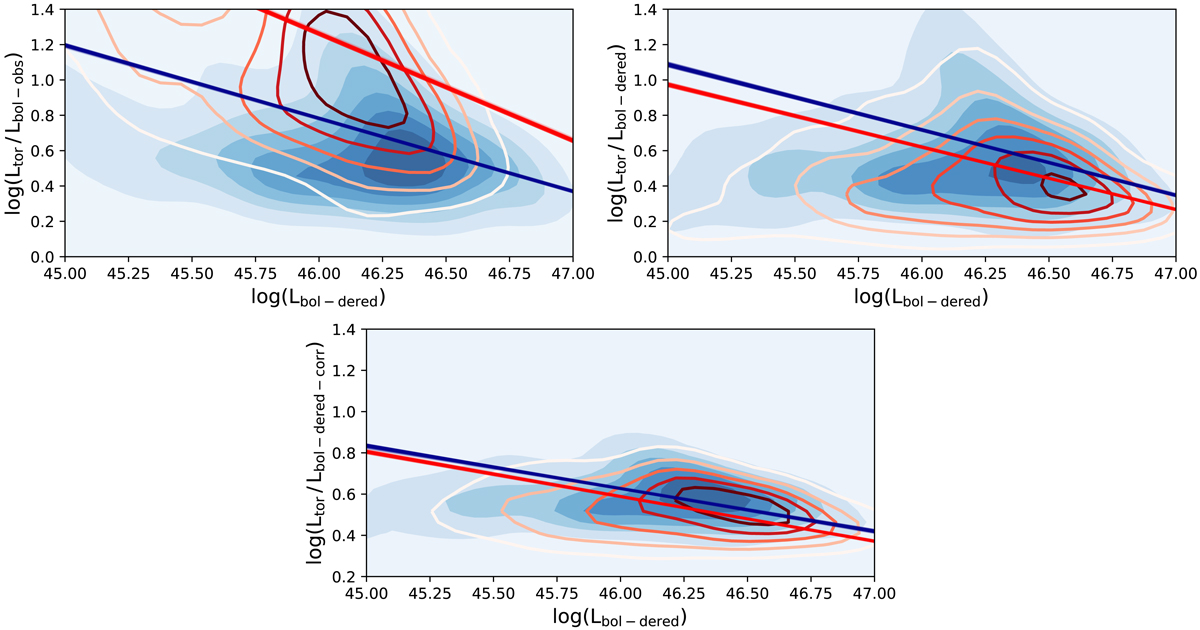
Composite two-dimensional posterior distributions of the torus reprocessing efficiency, defined as the ratio of torus luminosities and bolometric luminosities, plotted as a function of bolometric luminosities. These are constructed by sampling 100 realisations from the posterior of each source to properly account for the uncertainties. The red contour lines (for red QSOs) and the blue contour areas (for control QSOs) range between 20 and 100%, in intervals of 20%. Upper panels: this ratio for the observed bolometric luminosities (left panel) and for the reddening-corrected (intrinsic) bolometric luminosities (right panel) for red and control QSOs. Lower panel: torus reprocessing efficiency corrected for the torus anisotropy following Stalevski et al. (2016), to provide a better description of the covering factor.
Current usage metrics show cumulative count of Article Views (full-text article views including HTML views, PDF and ePub downloads, according to the available data) and Abstracts Views on Vision4Press platform.
Data correspond to usage on the plateform after 2015. The current usage metrics is available 48-96 hours after online publication and is updated daily on week days.
Initial download of the metrics may take a while.