Fig. 4.
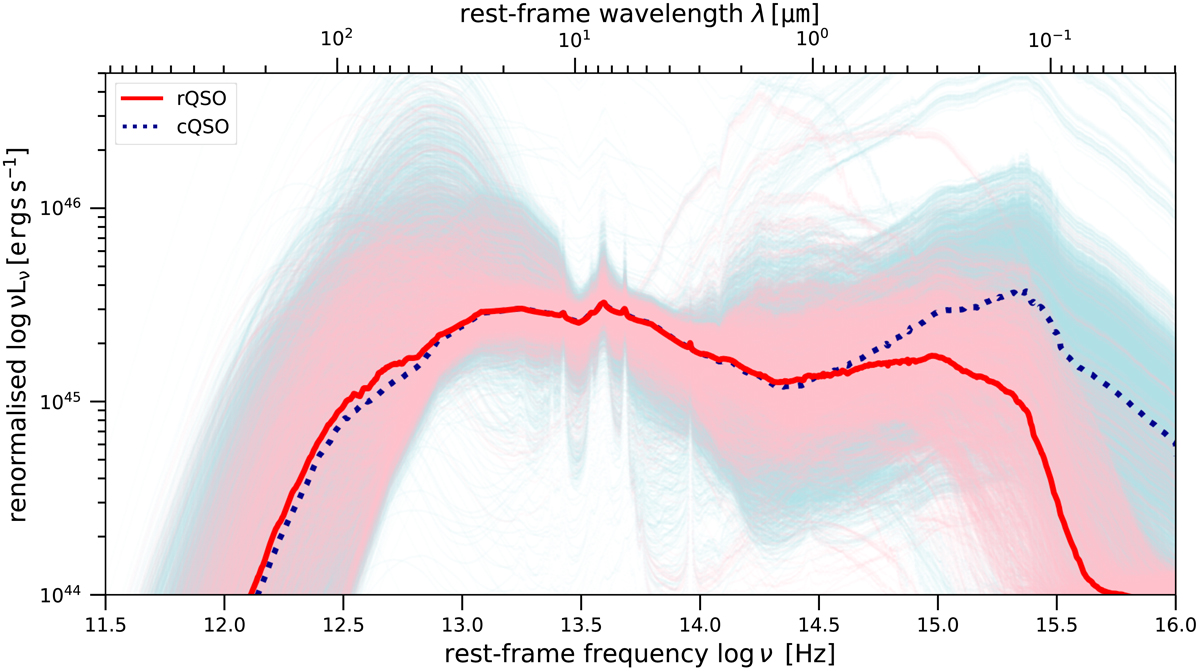
Ten modelled SEDs are plotted for each source (reconstructed from 10 randomly-picked realisations of the posterior PDFs) as transparent red (red QSOs) and blue lines (control QSOs) to display the uncertainties. Solid red and dotted blue lines depict the composite median SED for the red and control QSO population respectively, matched in redshift and L6 μm. At frequencies log ν < 14.5 Hz, strikingly similar composite SEDs can be observed for the red and control QSO populations. At frequencies log ν > 14.5 Hz a clear difference in the composite SEDs can be observed which is the signature of dust reddening consistent with the optical colour selection.
Current usage metrics show cumulative count of Article Views (full-text article views including HTML views, PDF and ePub downloads, according to the available data) and Abstracts Views on Vision4Press platform.
Data correspond to usage on the plateform after 2015. The current usage metrics is available 48-96 hours after online publication and is updated daily on week days.
Initial download of the metrics may take a while.