Fig. 3.
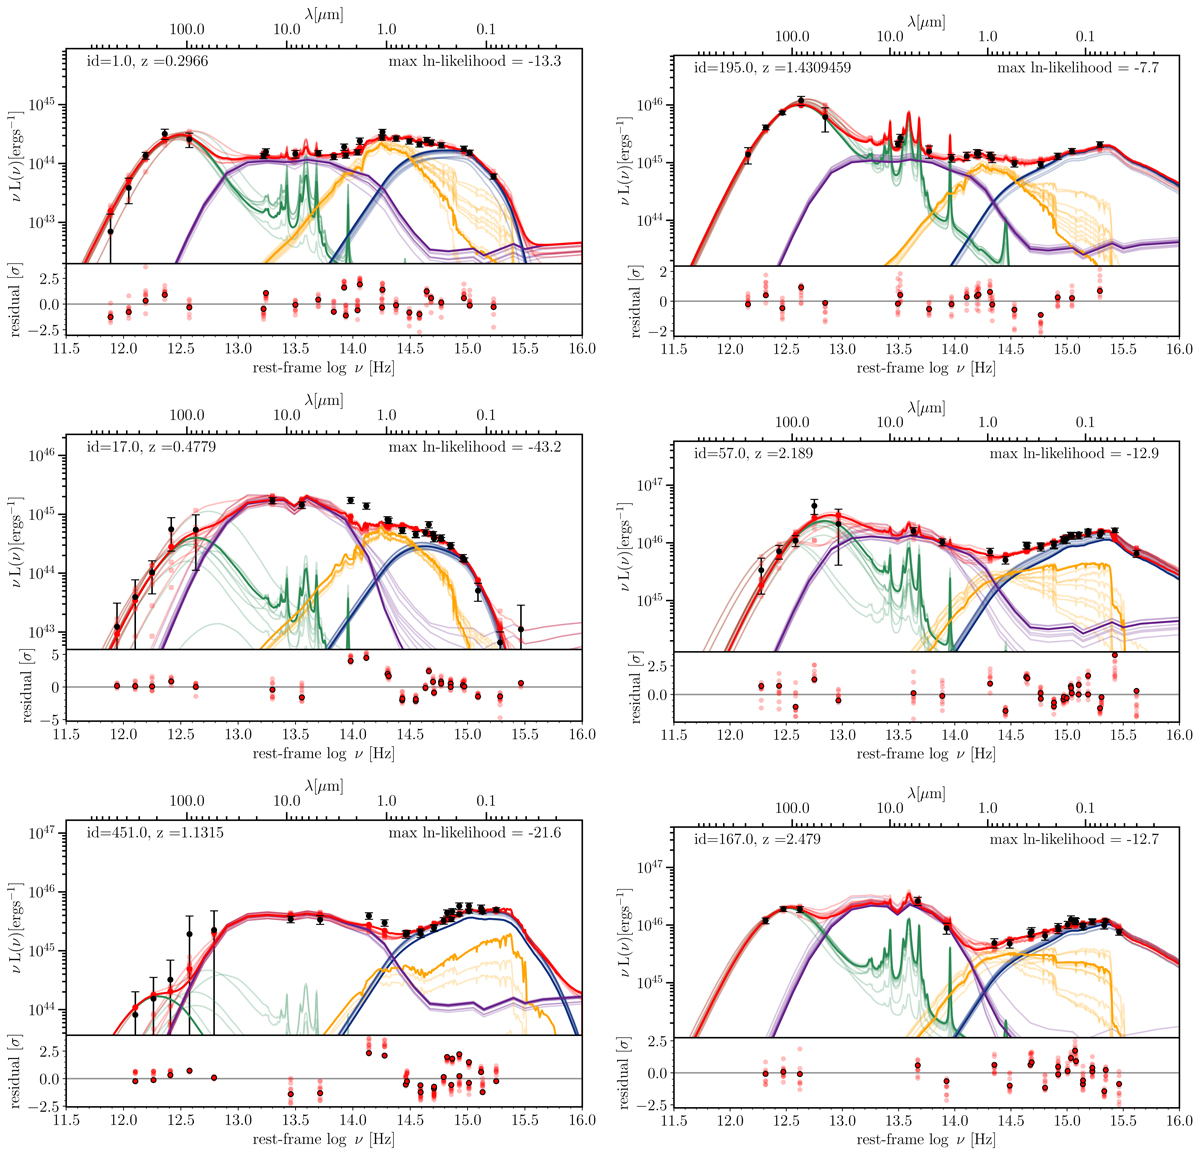
Examples of the SED decomposition with AGNfitter. In the main panels the photometric data points are shown with black error bars. The best fit and ten realisations of the posterior distributions of the fit are drawn as coloured solid, and transparent lines, respectively. The realisations display the uncertainties associated with the fits. The different colours represent the total SED (red lines), the accretion disk emission (blue lines), the host galaxy emission (yellow lines), the torus emission (purple lines) and the galactic cold dust emission (green lines). Lower panels: residuals expressed in terms of significance given the data noise level for the best fit and the 10 realisations. Through this selection of SED fits we exemplify the diversity of the obscuration levels found. Two examples of red QSO SEDs which clearly present an infrared excess emission at ∼3 μm, as discussed in Sect. 3.3.2, are included in the two lower left panels.
Current usage metrics show cumulative count of Article Views (full-text article views including HTML views, PDF and ePub downloads, according to the available data) and Abstracts Views on Vision4Press platform.
Data correspond to usage on the plateform after 2015. The current usage metrics is available 48-96 hours after online publication and is updated daily on week days.
Initial download of the metrics may take a while.