Fig. A.1.
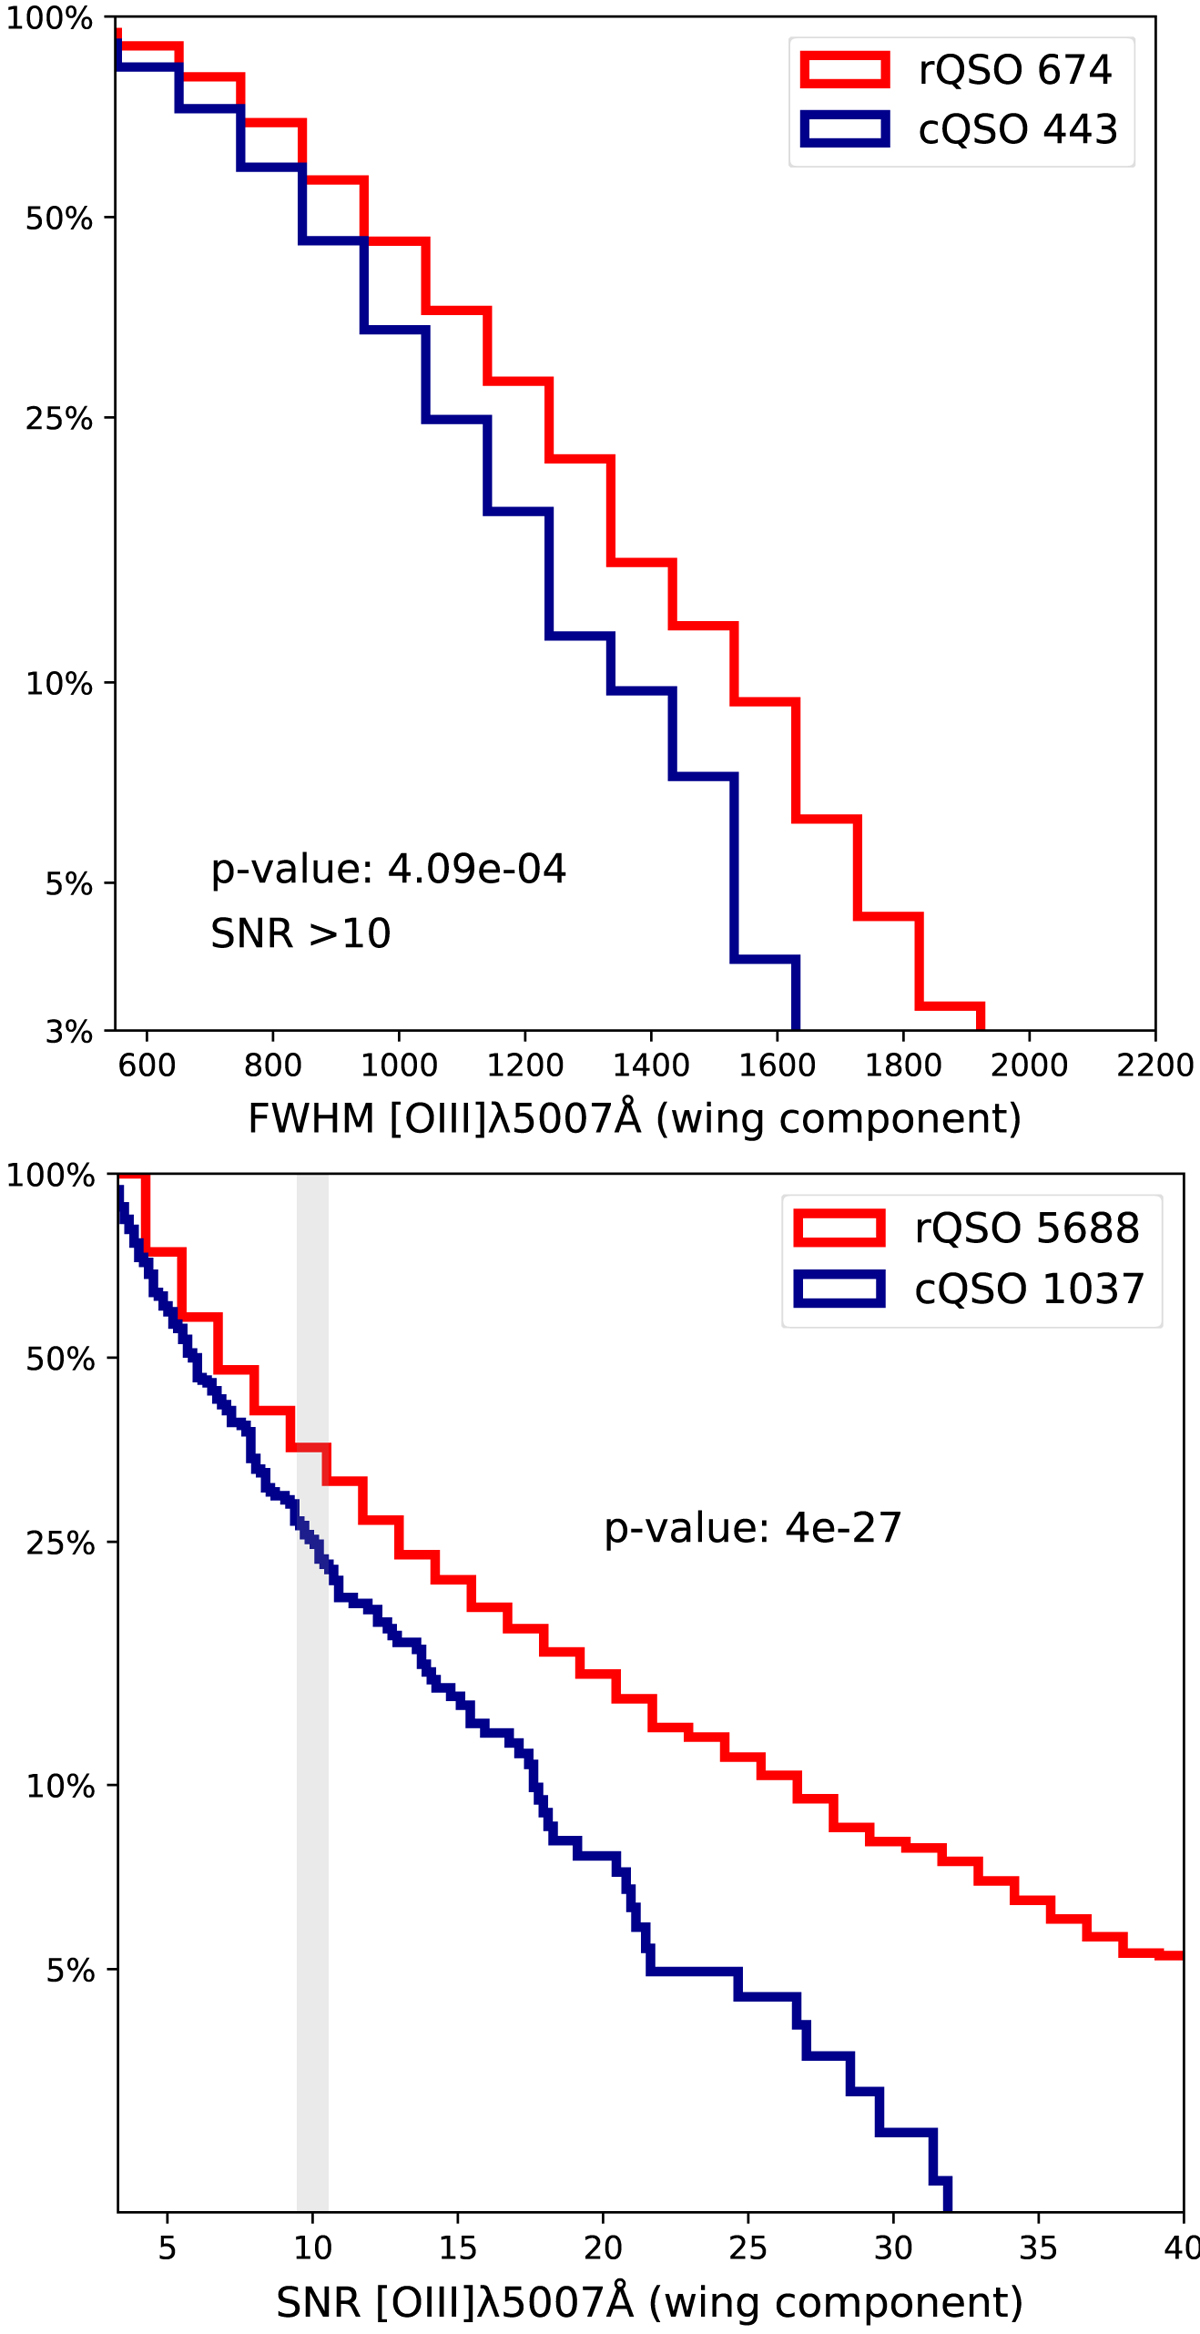
[O III] emission line properties for the luminosity-and-redshift-matched red and control QSO samples from the entire SDSS survey. Upper panel: comparison of all red and control QSOs with [O III] line measurements with Fpeak > 10 × rms5100 Å. It is important to note the number of red QSOs satisfying the condition is ∼50% larger than the control QSOs. This is shown more clearly in the lower panel, where the distribution of signal-to-noise ratio of the wing emission-line component, defined as = Fpeak(wing)/rms5100 Å, is shown for red and control QSOs. While here the only condition for a source to be included was to have [O III] detections, the number of red QSOs satisfying this condition is 5 times larger than that of the control sample.
Current usage metrics show cumulative count of Article Views (full-text article views including HTML views, PDF and ePub downloads, according to the available data) and Abstracts Views on Vision4Press platform.
Data correspond to usage on the plateform after 2015. The current usage metrics is available 48-96 hours after online publication and is updated daily on week days.
Initial download of the metrics may take a while.