Fig. 15.
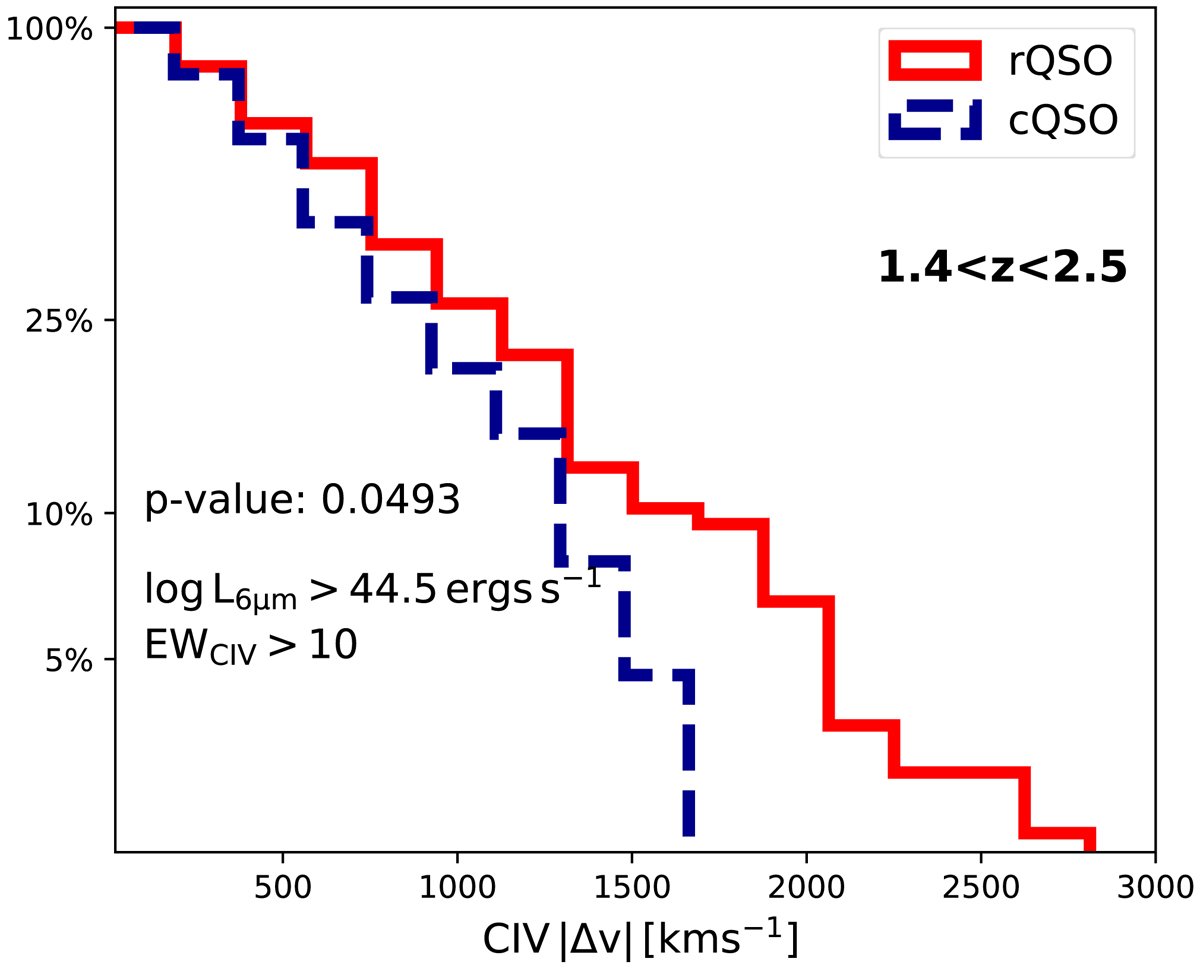
Cumulative distributions of the velocity shifts of the C IV emission line (in units of km s−1) for our samples of red and control QSOs, matched in redshift and luminosity. These samples cover the redshift range 1.4 < z < 2.5, complementing the results presented using the [O III] lines at low redshift (z < 1). A significant enhancement of C IV velocity shifts is found for red QSOs as compared to control QSOs, which is consistent with our finding in Fig. 13.
Current usage metrics show cumulative count of Article Views (full-text article views including HTML views, PDF and ePub downloads, according to the available data) and Abstracts Views on Vision4Press platform.
Data correspond to usage on the plateform after 2015. The current usage metrics is available 48-96 hours after online publication and is updated daily on week days.
Initial download of the metrics may take a while.