Fig. 1.
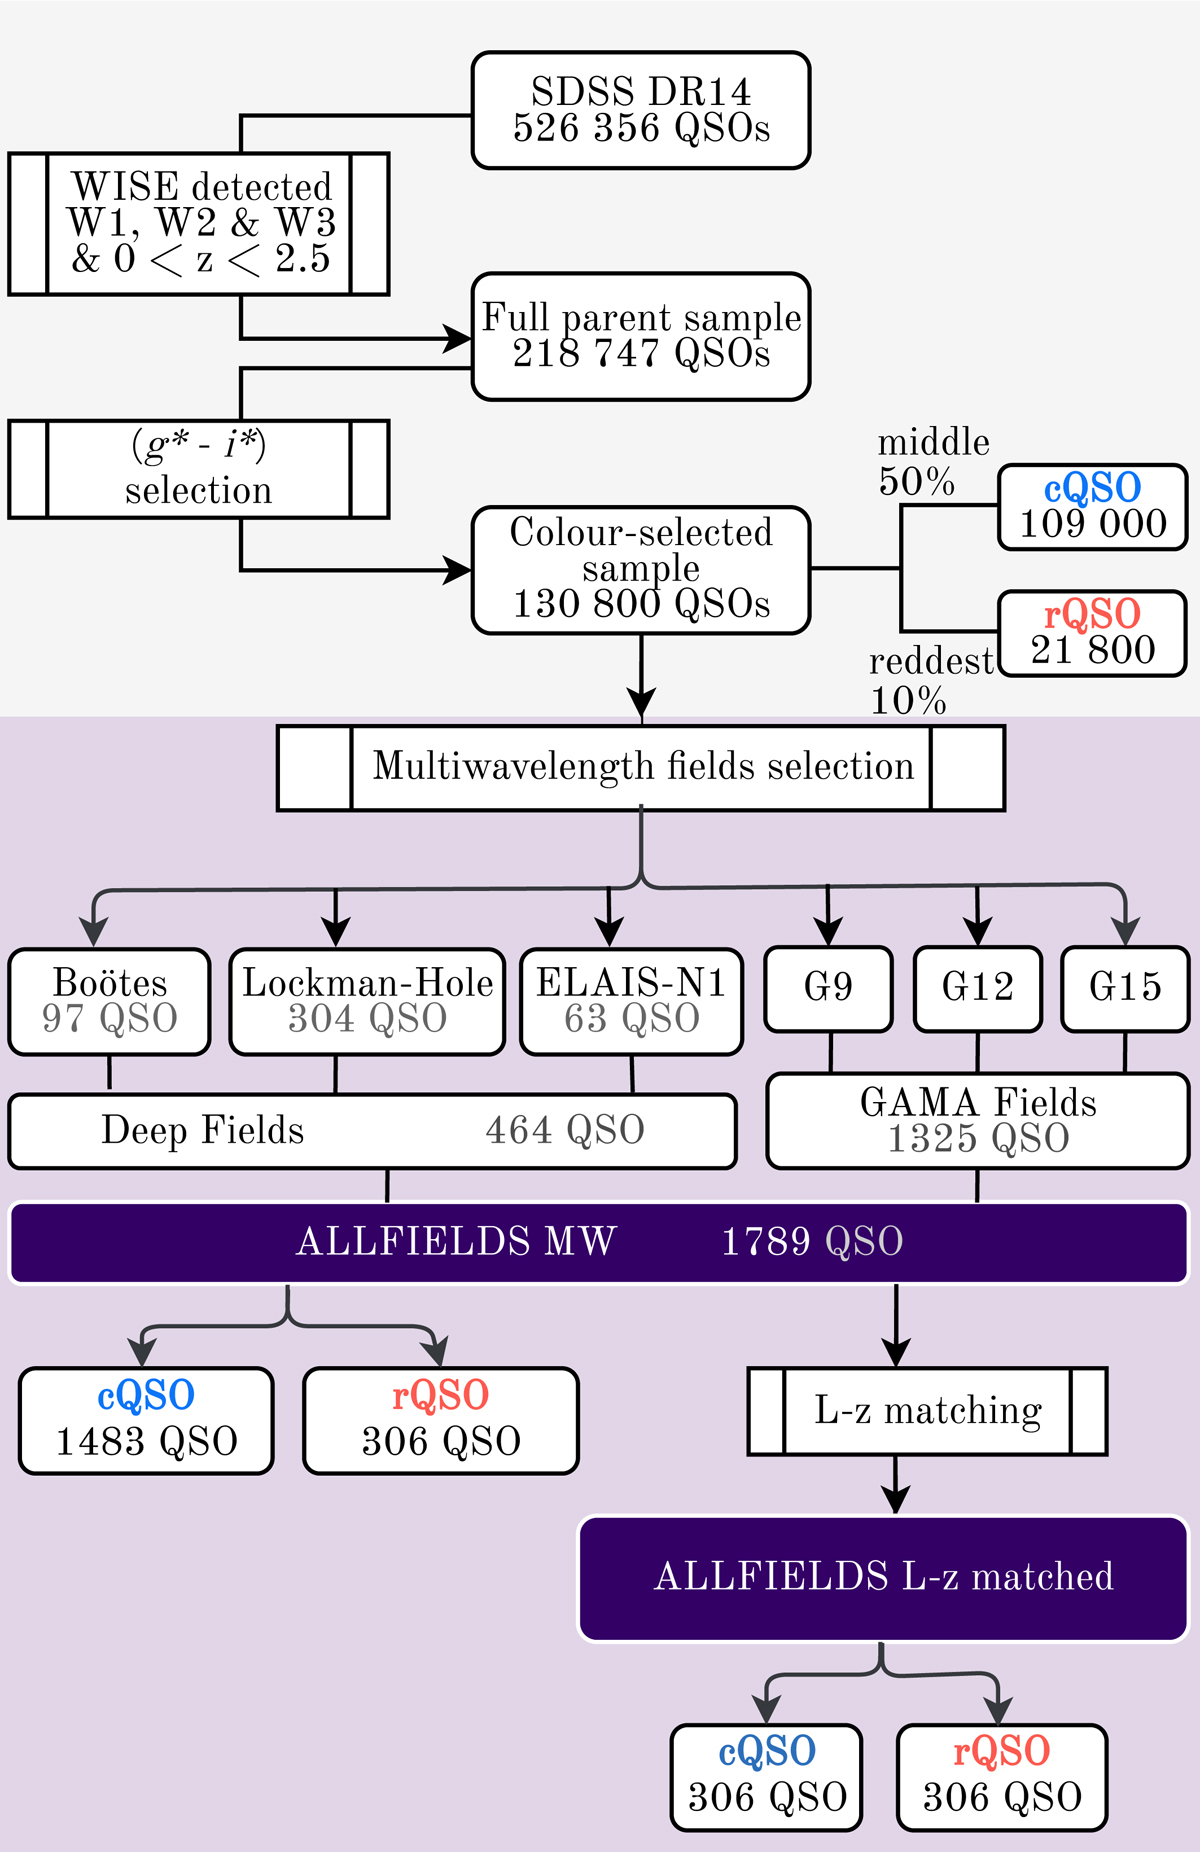
Diagram to summarize our selection process. The shaded area corresponds to the general definition of red and blue QSO samples from the overall SDSS DR14 (Pâris et al. 2018), following the strategy previously presented by Fawcett et al. (2020), Rosario et al. (2020). The purple shaded area correspond to the field selection, determined by the availability of deep multiwavelength catalogues provided by the LoTSS data release in three northern fields and the public compilation of the HELP collaboration in the three equatorial fields of the GAMA survey.
Current usage metrics show cumulative count of Article Views (full-text article views including HTML views, PDF and ePub downloads, according to the available data) and Abstracts Views on Vision4Press platform.
Data correspond to usage on the plateform after 2015. The current usage metrics is available 48-96 hours after online publication and is updated daily on week days.
Initial download of the metrics may take a while.