Fig. 2.
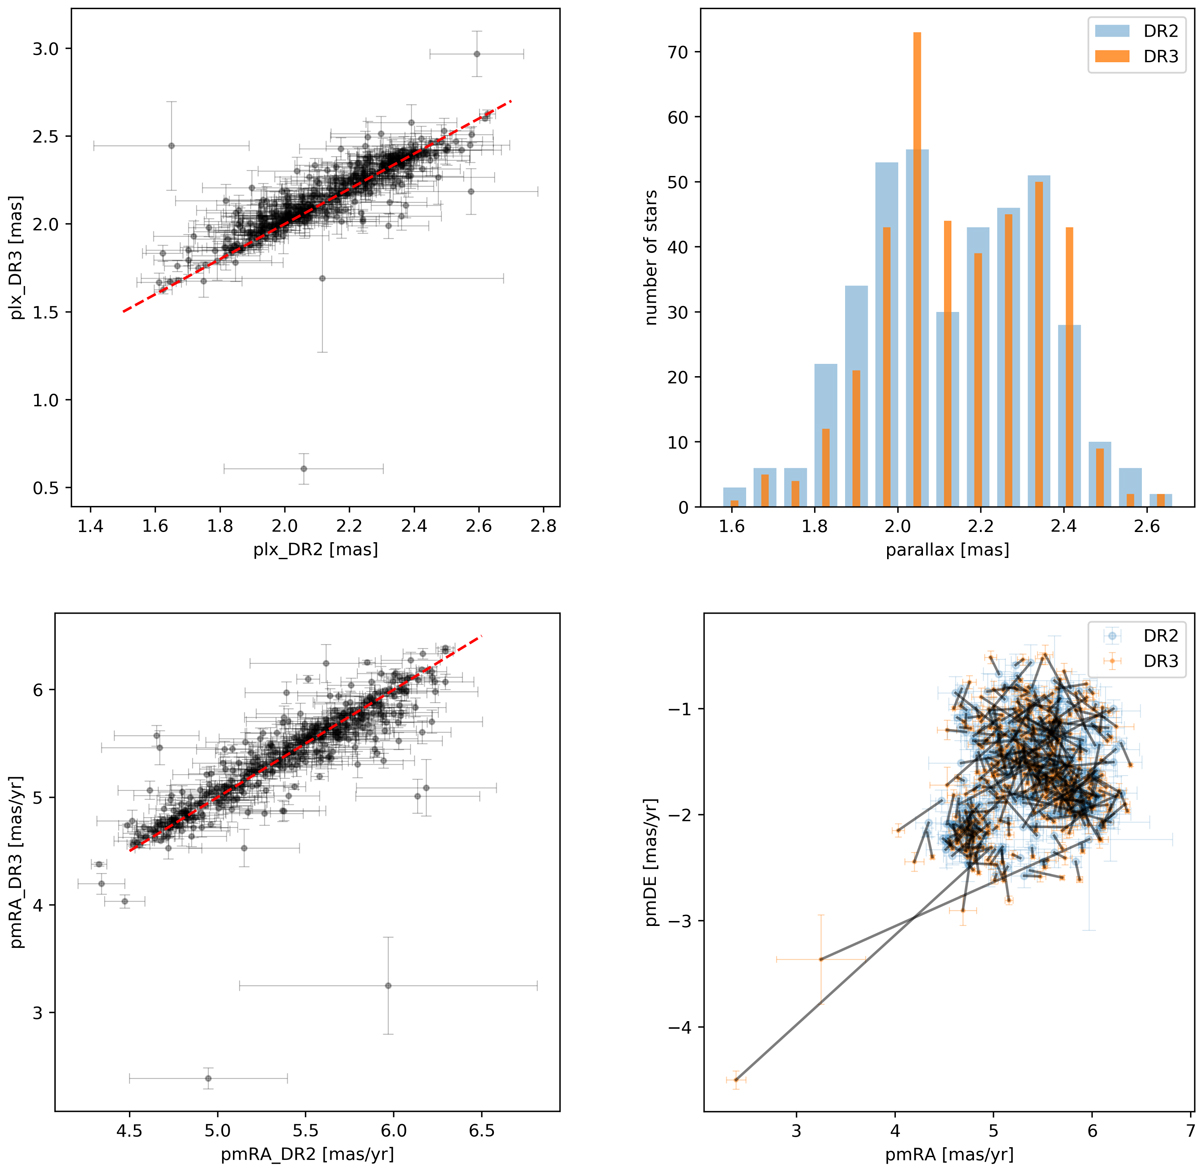
Comparison of the Agg53 (RSG 7, RSG 8) cluster members determined by CG20 based on the DR2 and the EDR3 data; duplicates were filtered out. Top-left: parallaxes of the clusters members. The red line represents the one-to-one relation. Top-right: histogram of parallaxes. Bottom-left: μα component of the proper motion. The red line represents the one-to-one relation. Bottom-right: the proper motion diagram. The shifts of the positions of points is indicated by the black lines.
Current usage metrics show cumulative count of Article Views (full-text article views including HTML views, PDF and ePub downloads, according to the available data) and Abstracts Views on Vision4Press platform.
Data correspond to usage on the plateform after 2015. The current usage metrics is available 48-96 hours after online publication and is updated daily on week days.
Initial download of the metrics may take a while.