Fig. 8.
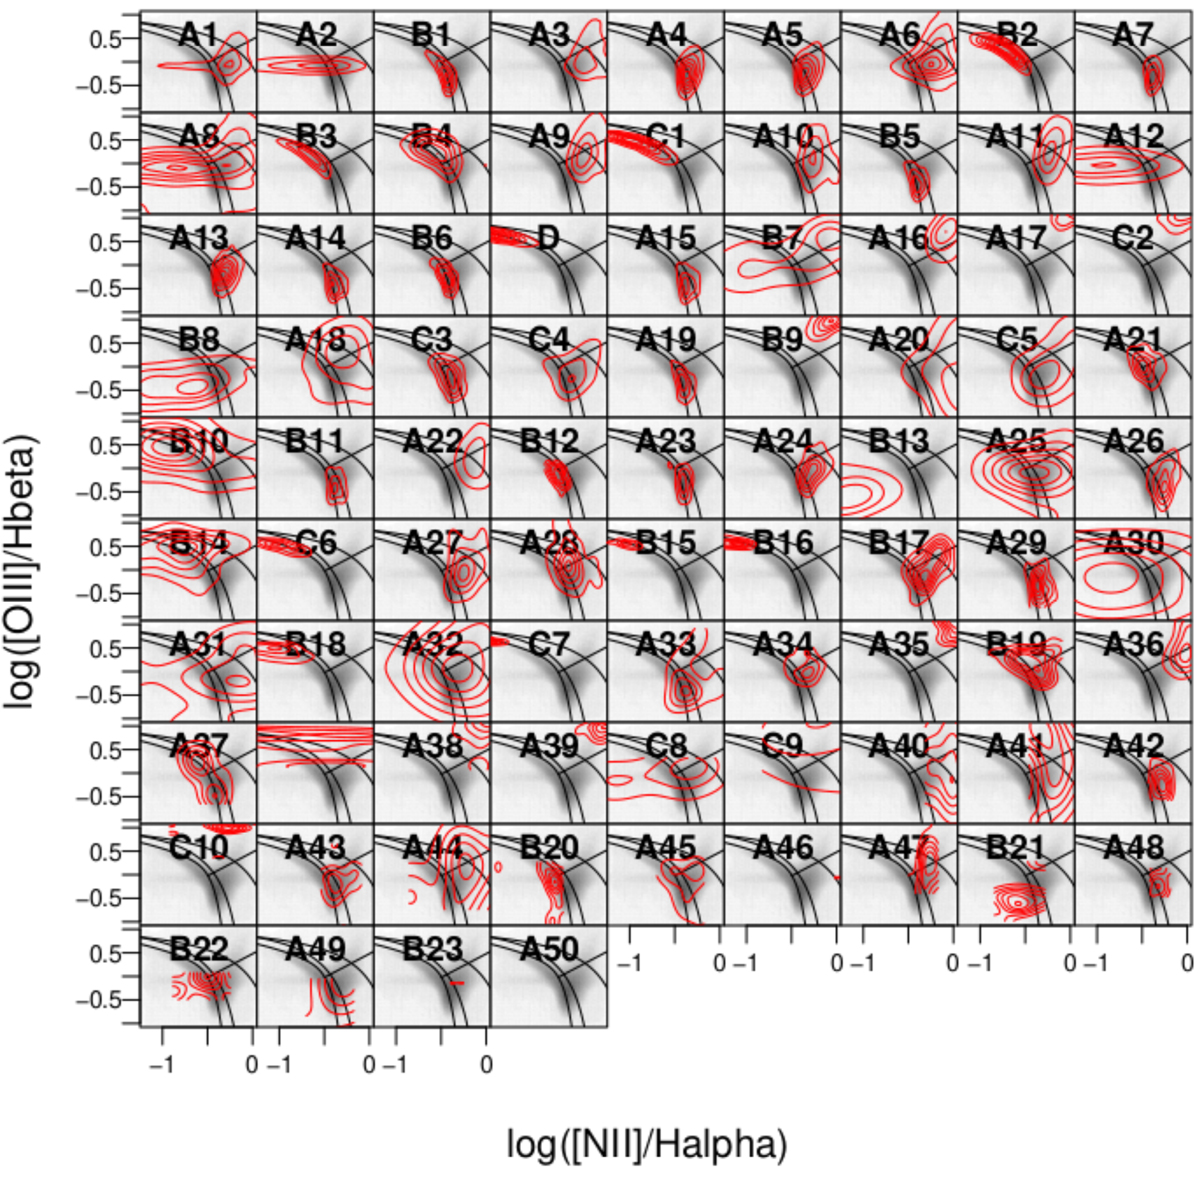
Distribution of our 86 classes in the (BPT) diagram. The distribution of all galaxies with indices present in the DR7 release (not all the 302 248 objects used for the classification) is shown in grey. The red contours show the distribution of the objects within each class. The curves are taken from Kewley et al. (2001), Kauffmann et al. (2003), Stasińska et al. (2006) (right to left respectively). The bottom left zone represents star-forming regions, the upper zone represents AGNs and Seyfert galaxies, and the bottom right zone represents LINERs.
Current usage metrics show cumulative count of Article Views (full-text article views including HTML views, PDF and ePub downloads, according to the available data) and Abstracts Views on Vision4Press platform.
Data correspond to usage on the plateform after 2015. The current usage metrics is available 48-96 hours after online publication and is updated daily on week days.
Initial download of the metrics may take a while.