Fig. 12.
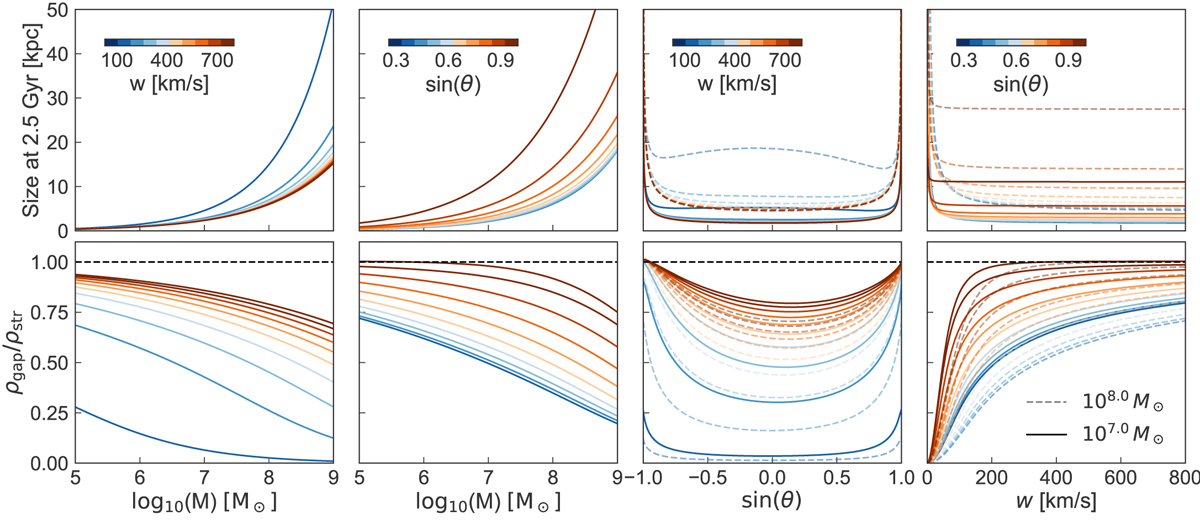
Top row: size of the gap after 2.5 Gyr of evolution as a function of the impact parameters (subhalo mass, angle θ, and amplitude of the relative velocity w). Bottom row: density contrast as a function of the same parameters. The two panels on the left show the discrete variation of the curves, varying the velocity amplitude w or collision angle θ. The two panels on the right show two sets of lines, solid for a subhalo of mass 107 M⊙ and dashed for 108 M⊙.
Current usage metrics show cumulative count of Article Views (full-text article views including HTML views, PDF and ePub downloads, according to the available data) and Abstracts Views on Vision4Press platform.
Data correspond to usage on the plateform after 2015. The current usage metrics is available 48-96 hours after online publication and is updated daily on week days.
Initial download of the metrics may take a while.