Fig. 11.
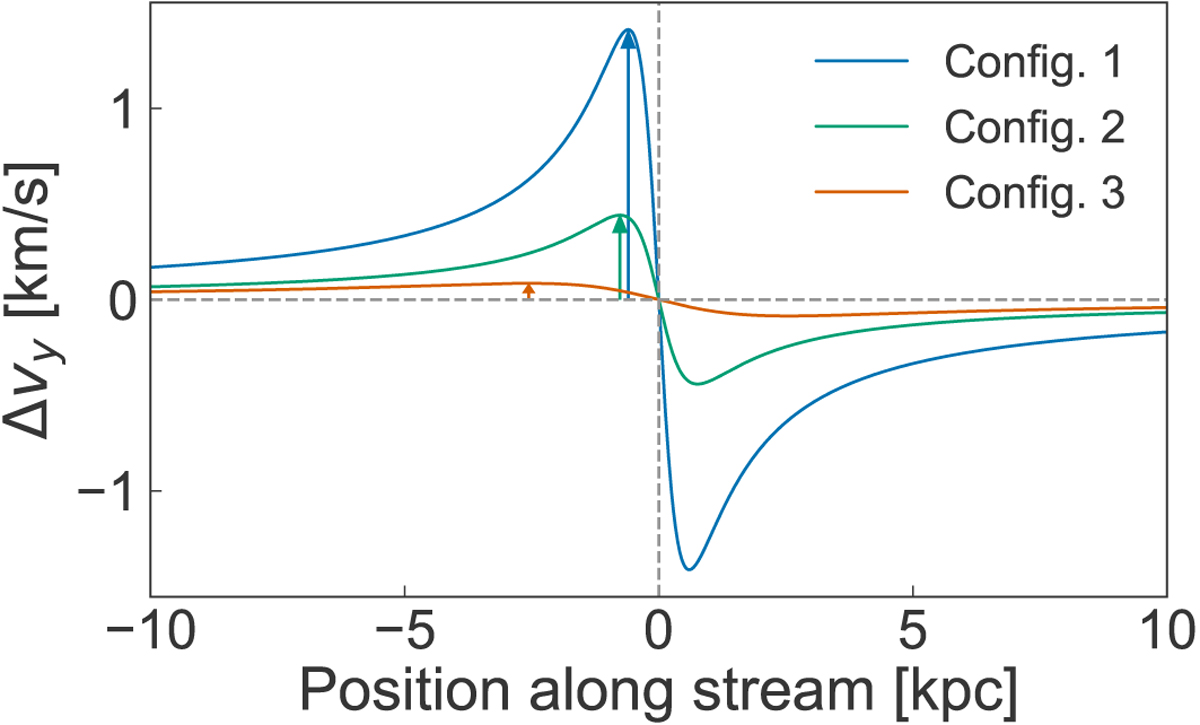
Profile of the change in velocity along the stream vy for the three different configurations described in the two previous figures. In Configuration 1 the stream experiences the largest kick on the smallest scale. On the other hand, in Configuration 3 the kick is much smaller but on a much larger scale. The arrows indicate the location of the maximum Δvy.
Current usage metrics show cumulative count of Article Views (full-text article views including HTML views, PDF and ePub downloads, according to the available data) and Abstracts Views on Vision4Press platform.
Data correspond to usage on the plateform after 2015. The current usage metrics is available 48-96 hours after online publication and is updated daily on week days.
Initial download of the metrics may take a while.