Free Access
Fig. 5.
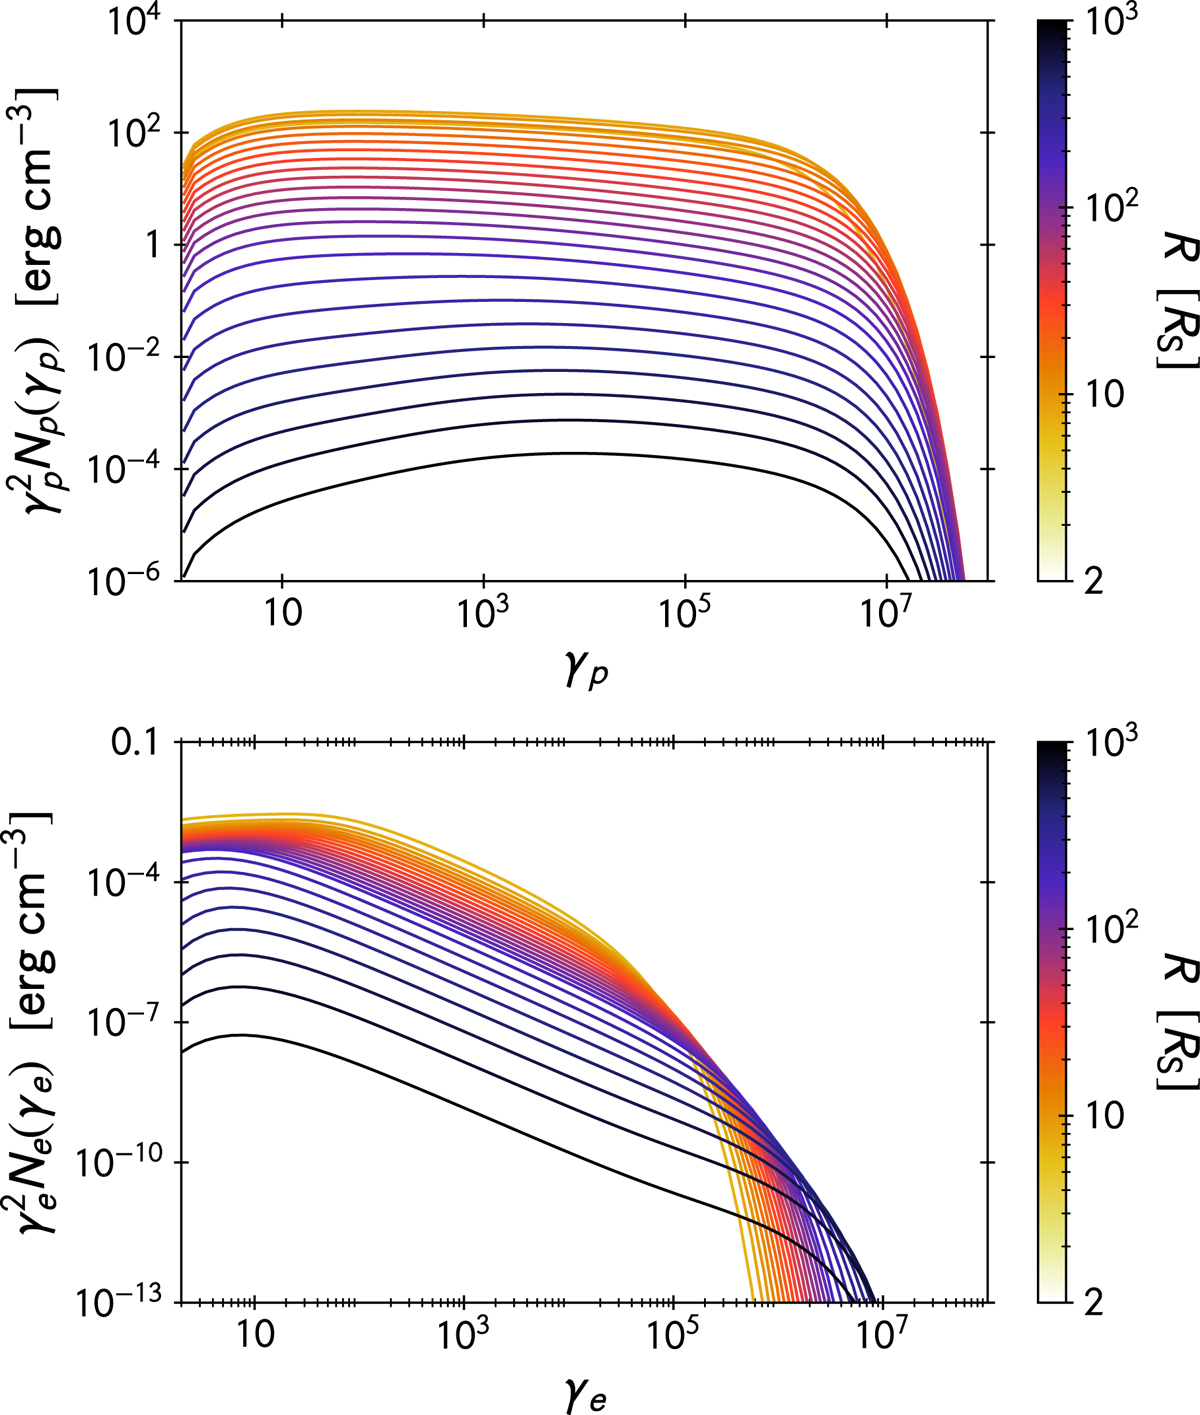
Steady particle energy distributions for Model B1 (see Table 1). Different colored lines show different regions in the RIAF, which are indicated in the colorbar. Upper panel: protons. Lower panel: electrons.
Current usage metrics show cumulative count of Article Views (full-text article views including HTML views, PDF and ePub downloads, according to the available data) and Abstracts Views on Vision4Press platform.
Data correspond to usage on the plateform after 2015. The current usage metrics is available 48-96 hours after online publication and is updated daily on week days.
Initial download of the metrics may take a while.