Fig. 1.
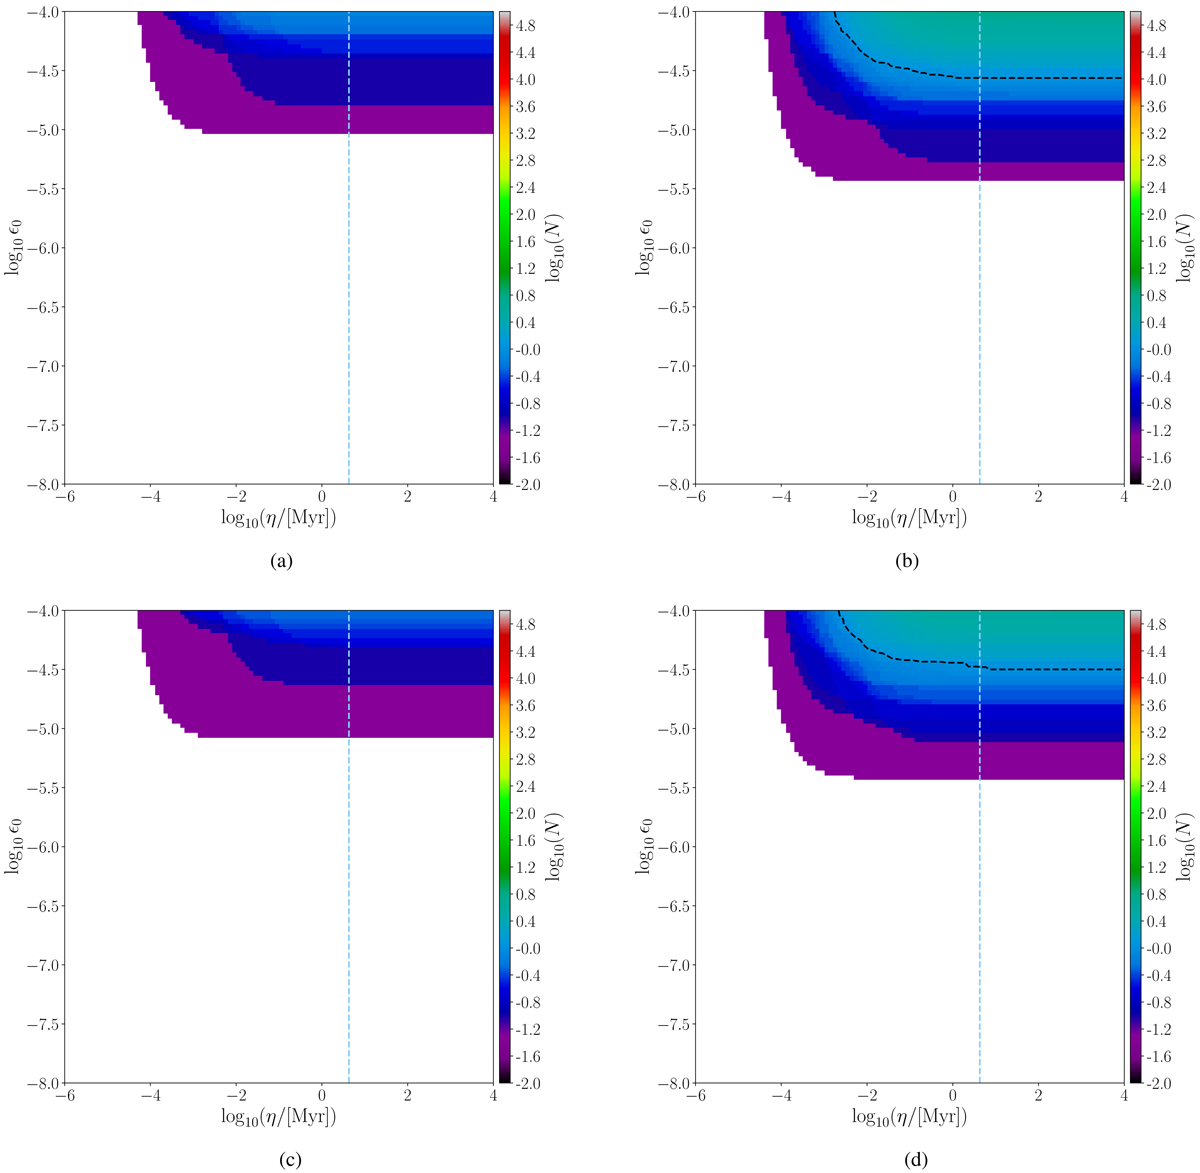
Number of observable pulsars in one-year observations in the space of the parameters of the model η − ϵ0 for the Advanced LIGO detectors. The left column corresponds to the signal’s ν harmonic, the right column the 2ν harmonic. The colour represents the expected number of detections for each model. The black dashed line in each plot corresponds to the models where one pulsar detection is expected. All models below the black dashed line correspond to less than one expected detection. The blue vertical dashed line indicates models where η is equal to the magnetic field decay Δ (see Table 1). (a) ν. L1 Advanced LIGO detector at Livingston. (b) 2ν. L1 Advanced LIGO detector at Livingston. (c) ν. H1 Advanced LIGO detector at Hanford. (d) 2ν. H1 Advanced LIGO detector at Hanford.
Current usage metrics show cumulative count of Article Views (full-text article views including HTML views, PDF and ePub downloads, according to the available data) and Abstracts Views on Vision4Press platform.
Data correspond to usage on the plateform after 2015. The current usage metrics is available 48-96 hours after online publication and is updated daily on week days.
Initial download of the metrics may take a while.