Fig. 7
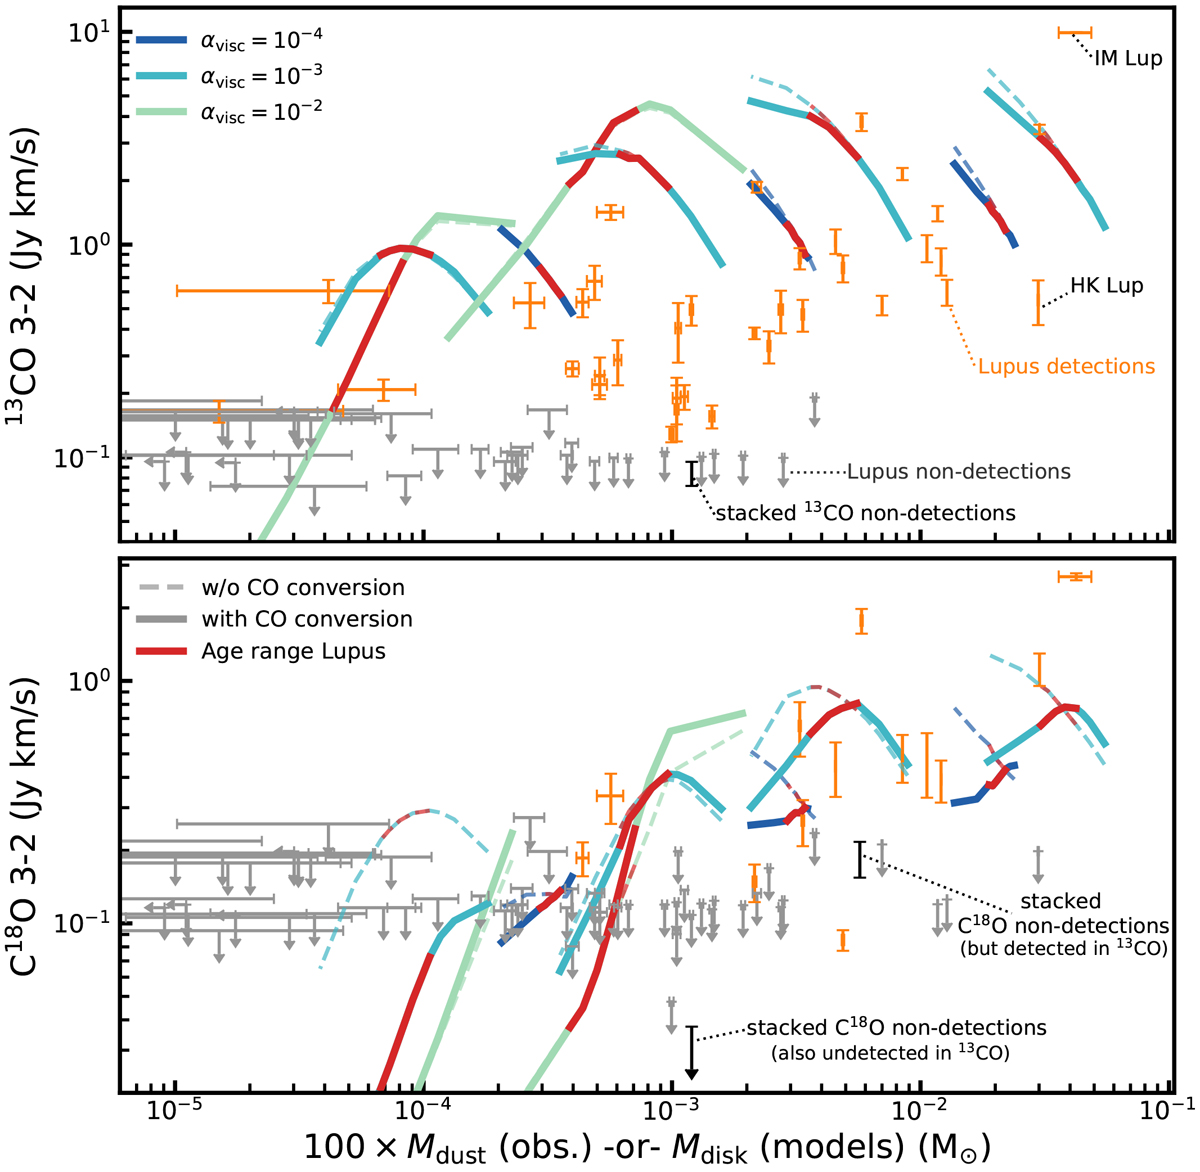
13CO (top) and C18O (bottom) J = −2 line fluxes versus disk mass. Solid lines show models that include CO conversion through grain-surface chemistry. For comparison, dashed lines show the models without grain-surface chemistry. For the observations, shown in orange, we use Mgas ≃ 100 × Mdust as a proxy for the disk mass (see, e.g., Ansdell et al. 2016, 2018; Yen et al. 2018). Colors show models with different viscous alpha. Models with age between 1 and 3 Myr, the approximate age of Lupus, are highlighted in red. We note that in our models Mdisk decreases with time, meaning that time runs right to left in this figure for our models. Observations for which we only have an upper limit on the 13 CO or C18 O line flux are shown in gray. Stacked non-detections are shown in black (cf. Sect. 3.3).
Current usage metrics show cumulative count of Article Views (full-text article views including HTML views, PDF and ePub downloads, according to the available data) and Abstracts Views on Vision4Press platform.
Data correspond to usage on the plateform after 2015. The current usage metrics is available 48-96 hours after online publication and is updated daily on week days.
Initial download of the metrics may take a while.