Fig. 4
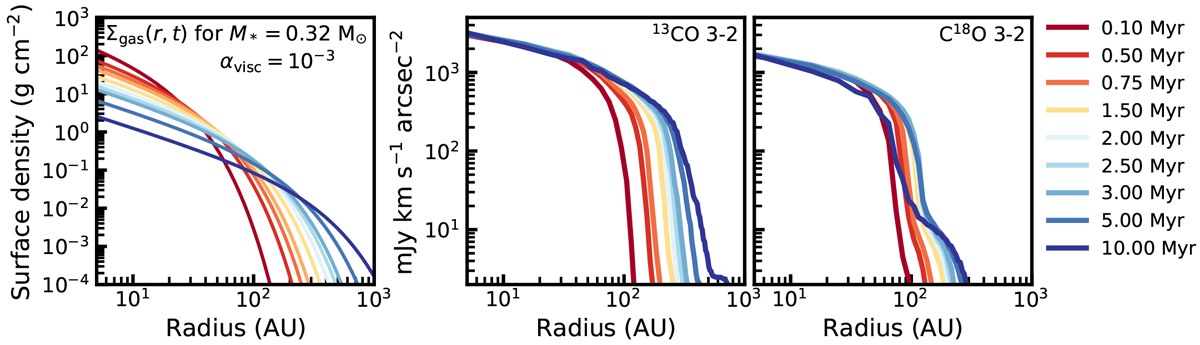
Time evolution of the surface density profile (left panel), with the middle and right panel showing the corresponding 13CO J = 3−2 and C18O J = 3−2 intensity profiles, respectively. The model shown here has M* = 0.32 M⊙, α = 10−3 and Mdisk(t = 0) = 10−2 M⊙. The colors, going from red to blue, show different time steps. 13CO and C18O 3–2 intensity profiles for all models can be found in Appendix A.
Current usage metrics show cumulative count of Article Views (full-text article views including HTML views, PDF and ePub downloads, according to the available data) and Abstracts Views on Vision4Press platform.
Data correspond to usage on the plateform after 2015. The current usage metrics is available 48-96 hours after online publication and is updated daily on week days.
Initial download of the metrics may take a while.