Fig. 6.
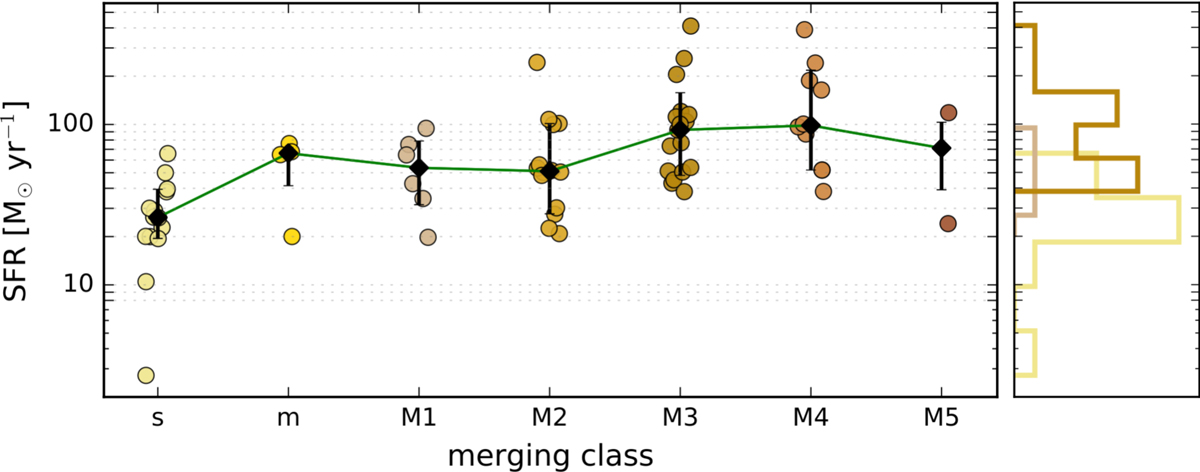
SFR of (U)LIRGs in different merging stages, as derived from CIGALE. Each circle corresponds to an individual source. Black diamonds stand for the median values per merging class, while error bars indicate the range between the 16th and 84th percentiles from the median. Side plots of the distributions of class ‘s’, ‘M1’, and ‘M3’ systems, with the corresponding colour, are also presented.
Current usage metrics show cumulative count of Article Views (full-text article views including HTML views, PDF and ePub downloads, according to the available data) and Abstracts Views on Vision4Press platform.
Data correspond to usage on the plateform after 2015. The current usage metrics is available 48-96 hours after online publication and is updated daily on week days.
Initial download of the metrics may take a while.