Fig. 5.
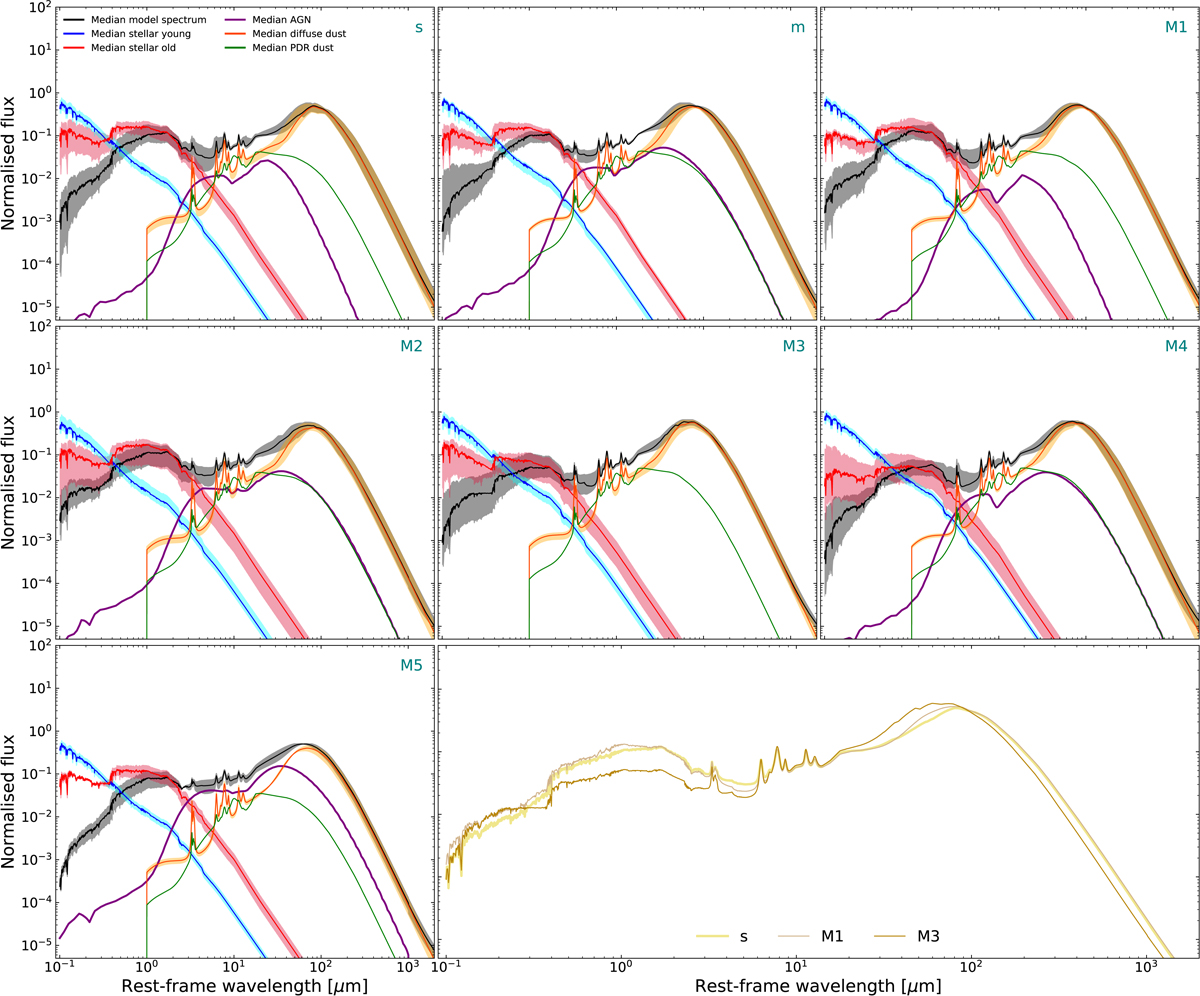
Median SEDs of the local (U)LIRGs, separated in classes based on their merging stage. Classes ‘s’, ‘m’, and ‘M1’ are presented in the three top panels (from left to right), and classes ‘M2’, ‘M3, and ‘M4’ are presented in the three middle panels, while in the bottom-left panel the median SED of the ‘M5’ class is plotted. The curves and the shaded areas are coloured in the same manner as in Fig. 2. The bottom-right panel shows the comparison among the median SEDs of ‘s’, ‘M1’, and ‘M3’ classes, allowing for the differences to be spotted.
Current usage metrics show cumulative count of Article Views (full-text article views including HTML views, PDF and ePub downloads, according to the available data) and Abstracts Views on Vision4Press platform.
Data correspond to usage on the plateform after 2015. The current usage metrics is available 48-96 hours after online publication and is updated daily on week days.
Initial download of the metrics may take a while.