Fig. 4.
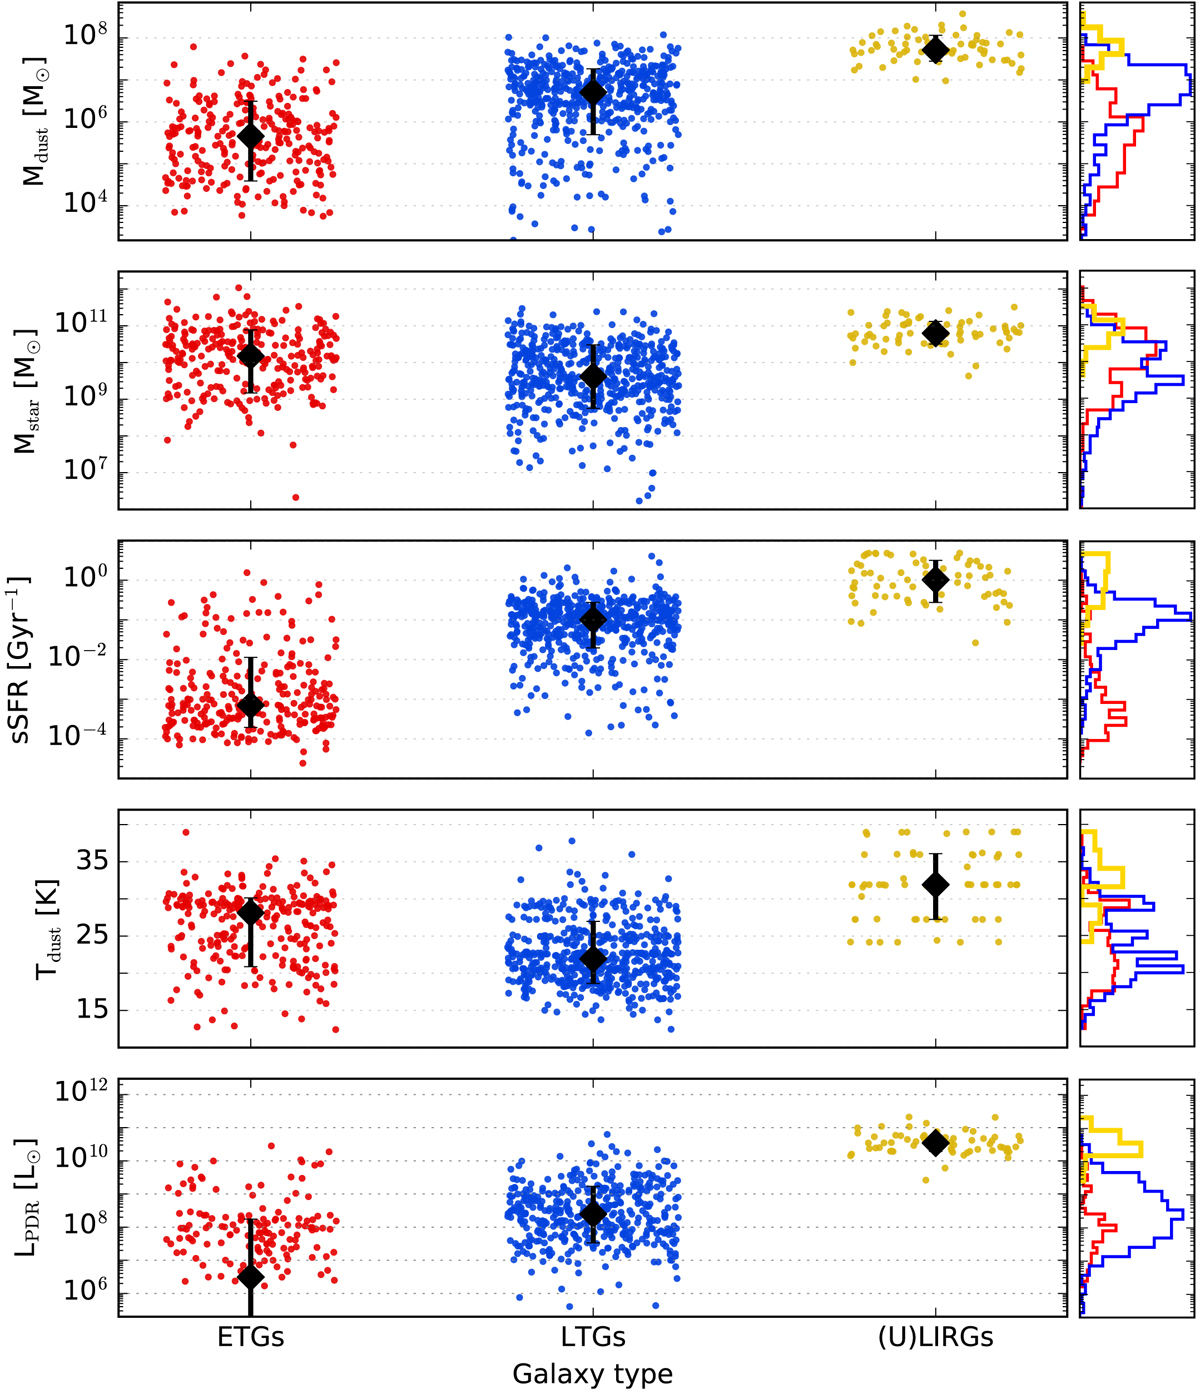
Physical properties, as derived by CIGALE, for the different galaxy types. From top to bottom, Mdust, Mstar, sSFR, Tdust, and LPDR are plotted as a function of galaxy type. Each red and blue dot corresponds to an individual ETG and LTG galaxy, while yellow dots correspond to (U)LIRGs, respectively. Black diamonds stand for the median values per galaxy type, while the associated 16th and 84th percentile ranges are indicated with error bars. Side plots of the distributions of each galaxy type for all the physical properties are also presented, following the same colouring as for the dots. In the bottom panel (LPDR), the median value of ETGs is dragged down to lower values because CIGALE predicts no PDR contribution for some sources (see the text for more details).
Current usage metrics show cumulative count of Article Views (full-text article views including HTML views, PDF and ePub downloads, according to the available data) and Abstracts Views on Vision4Press platform.
Data correspond to usage on the plateform after 2015. The current usage metrics is available 48-96 hours after online publication and is updated daily on week days.
Initial download of the metrics may take a while.