Fig. 3.
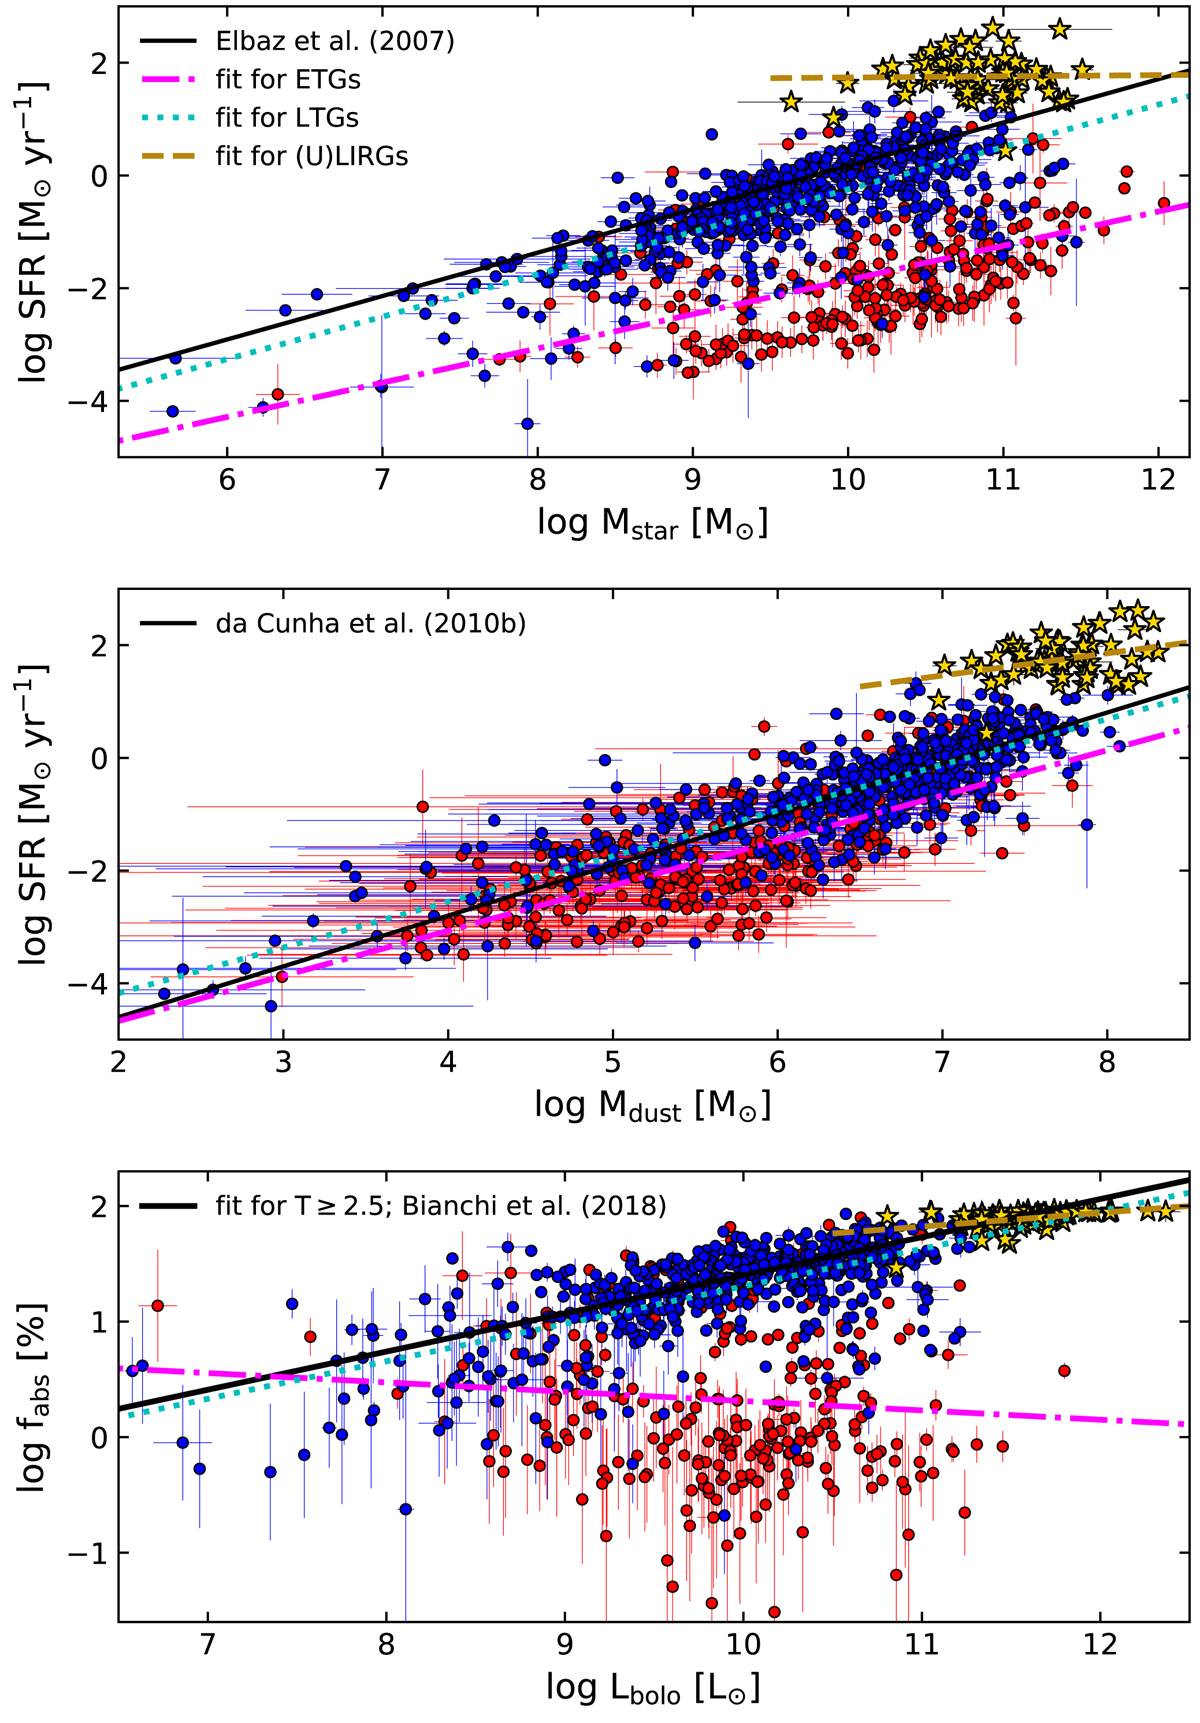
Correlations of SFR with stellar mass and dust mass (upper and middle panels respectively), and between fabs and Lbolo (bottom panel; see the text for the definition of the parameters). The DustPedia ETGs and LTGs are shown with red and blue circles, respectively, while yellow stars are the local (U)LIRGs in our sample. All values are plotted along with their corresponding uncertainties. In all plots, magenta dash-dotted, cyan dotted, and yellow dashed lines are the linear fits to the ETGs, LTGs, and (U)LIRGs, respectively. The black solid lines correspond to the best fits found in Elbaz et al. (2007) to the 0.015 ≤ z ≤ 0.1 SDSS star-forming galaxies (top panel), to the best fit found in da Cunha et al. (2010b) for a sample of low redshift galaxies (middle panel), and to the best fit found in Bianchi et al. (2018) for the DustPedia galaxies with T ≥ 2.5 (bottom panel).
Current usage metrics show cumulative count of Article Views (full-text article views including HTML views, PDF and ePub downloads, according to the available data) and Abstracts Views on Vision4Press platform.
Data correspond to usage on the plateform after 2015. The current usage metrics is available 48-96 hours after online publication and is updated daily on week days.
Initial download of the metrics may take a while.