Fig. C.2.
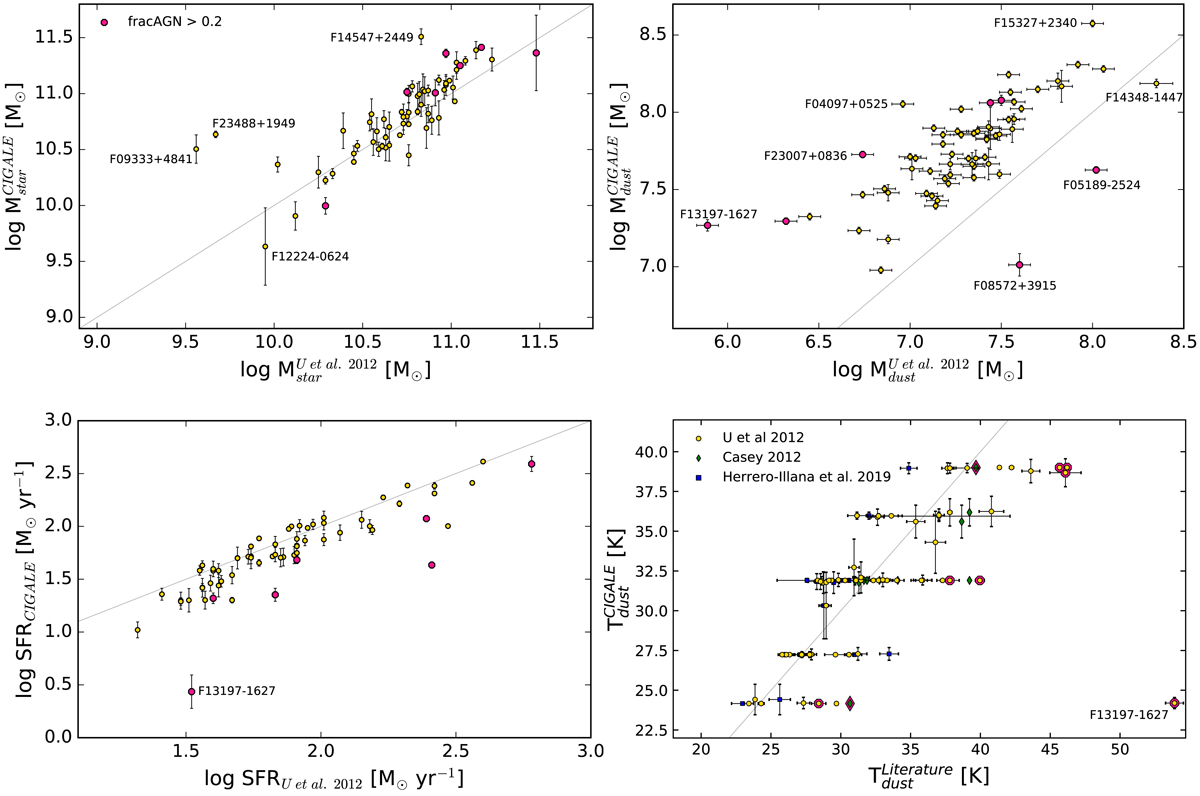
Comparison between the CIGALE derived properties (this work), Mstar (top-left panel), Mdust (top-right panel), the SFR (bottom-left panel), and Tdust (bottom-right panel) and the corresponding properties presented in U et al. (2012). Pink octagons indicate sources with strong AGN (fracAGN > 0.2). Wherever available, values come with their uncertainties. The grey solid line corresponds to the one-to-one relation. Extreme outliers are indicated with their IRAS names. In the bottom-right panel, green diamonds correspond to the comparison with the dust temperatures derived in Casey (2012), while blue boxes correspond to the comparison with the ones derived in Herrero-Illana et al. (2019). In this panel, sources with strong AGN are indicated by a pink edge-colour.
Current usage metrics show cumulative count of Article Views (full-text article views including HTML views, PDF and ePub downloads, according to the available data) and Abstracts Views on Vision4Press platform.
Data correspond to usage on the plateform after 2015. The current usage metrics is available 48-96 hours after online publication and is updated daily on week days.
Initial download of the metrics may take a while.