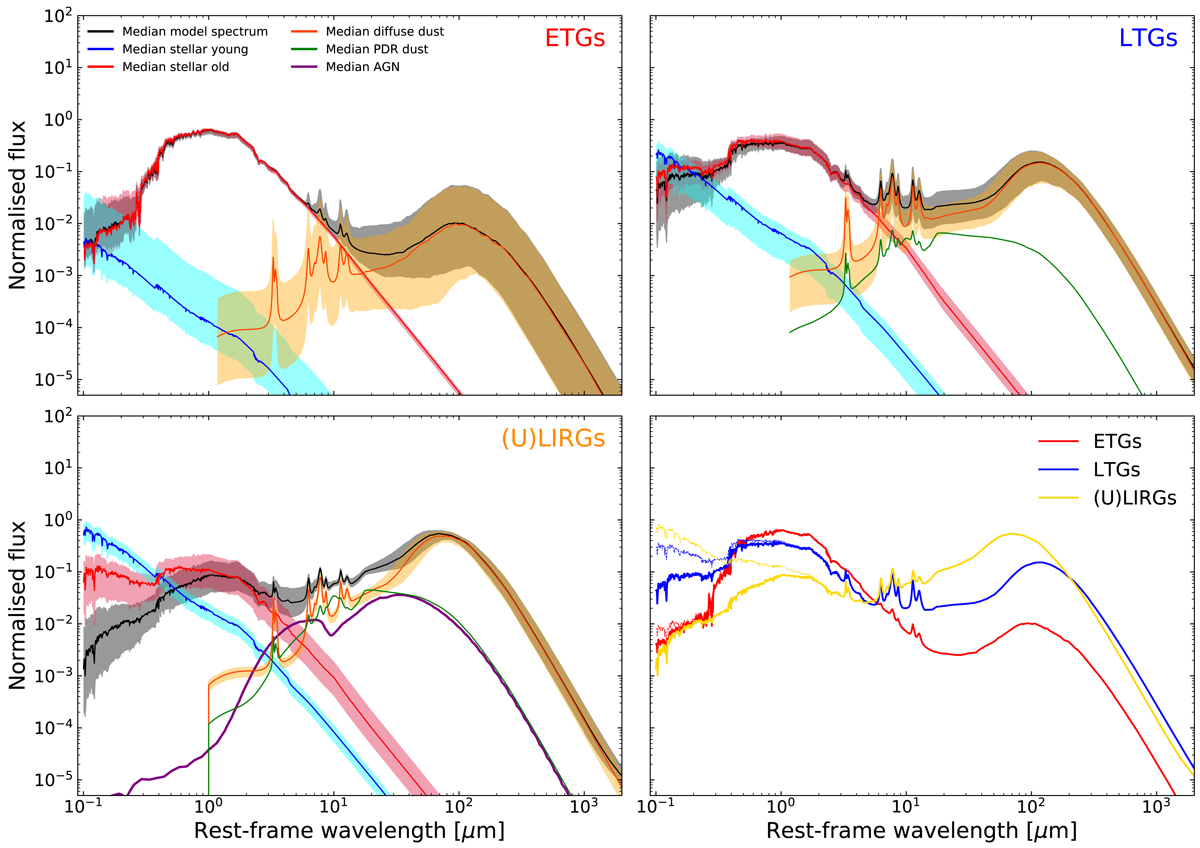
Fig. 2.

Template SEDs of the DustPedia ETGs (top-left panel), LTGs (top-right panel), and the local (U)LIRGs (bottom-left panel), as modelled by CIGALE. The black curves indicate the median SEDs, while the blue and red curves denote the median unattenuated SEDs of the young and old stellar populations, respectively. The median distribution of the diffuse dust is shown by the orange curve and the emission from the PDRs is shown by the green curve. The purple curve, in the bottom-left panel, indicates the median AGN distribution. The shaded areas cover the range between the 16th and 84th percentiles to the median values. For clarity reasons, since the PDR and the AGN components may vary substantially, we chose not to present the percentile widths of the curves. The median SEDs of the three different types of local galaxies are plotted in the bottom-right panel. The red curve represents the median, observed, SED of ETGs, the blue curve represents the one of LTGs, while the yellow curve corresponds to the median SED of (U)LIRGs. The thin, dotted curves show the unattenuated total stellar emission for the different classes. The reader is also referred to the corresponding median SEDs in Bianchi et al. (2018) and Nersesian et al. (2019).
Current usage metrics show cumulative count of Article Views (full-text article views including HTML views, PDF and ePub downloads, according to the available data) and Abstracts Views on Vision4Press platform.
Data correspond to usage on the plateform after 2015. The current usage metrics is available 48-96 hours after online publication and is updated daily on week days.
Initial download of the metrics may take a while.


