Fig. A.1.
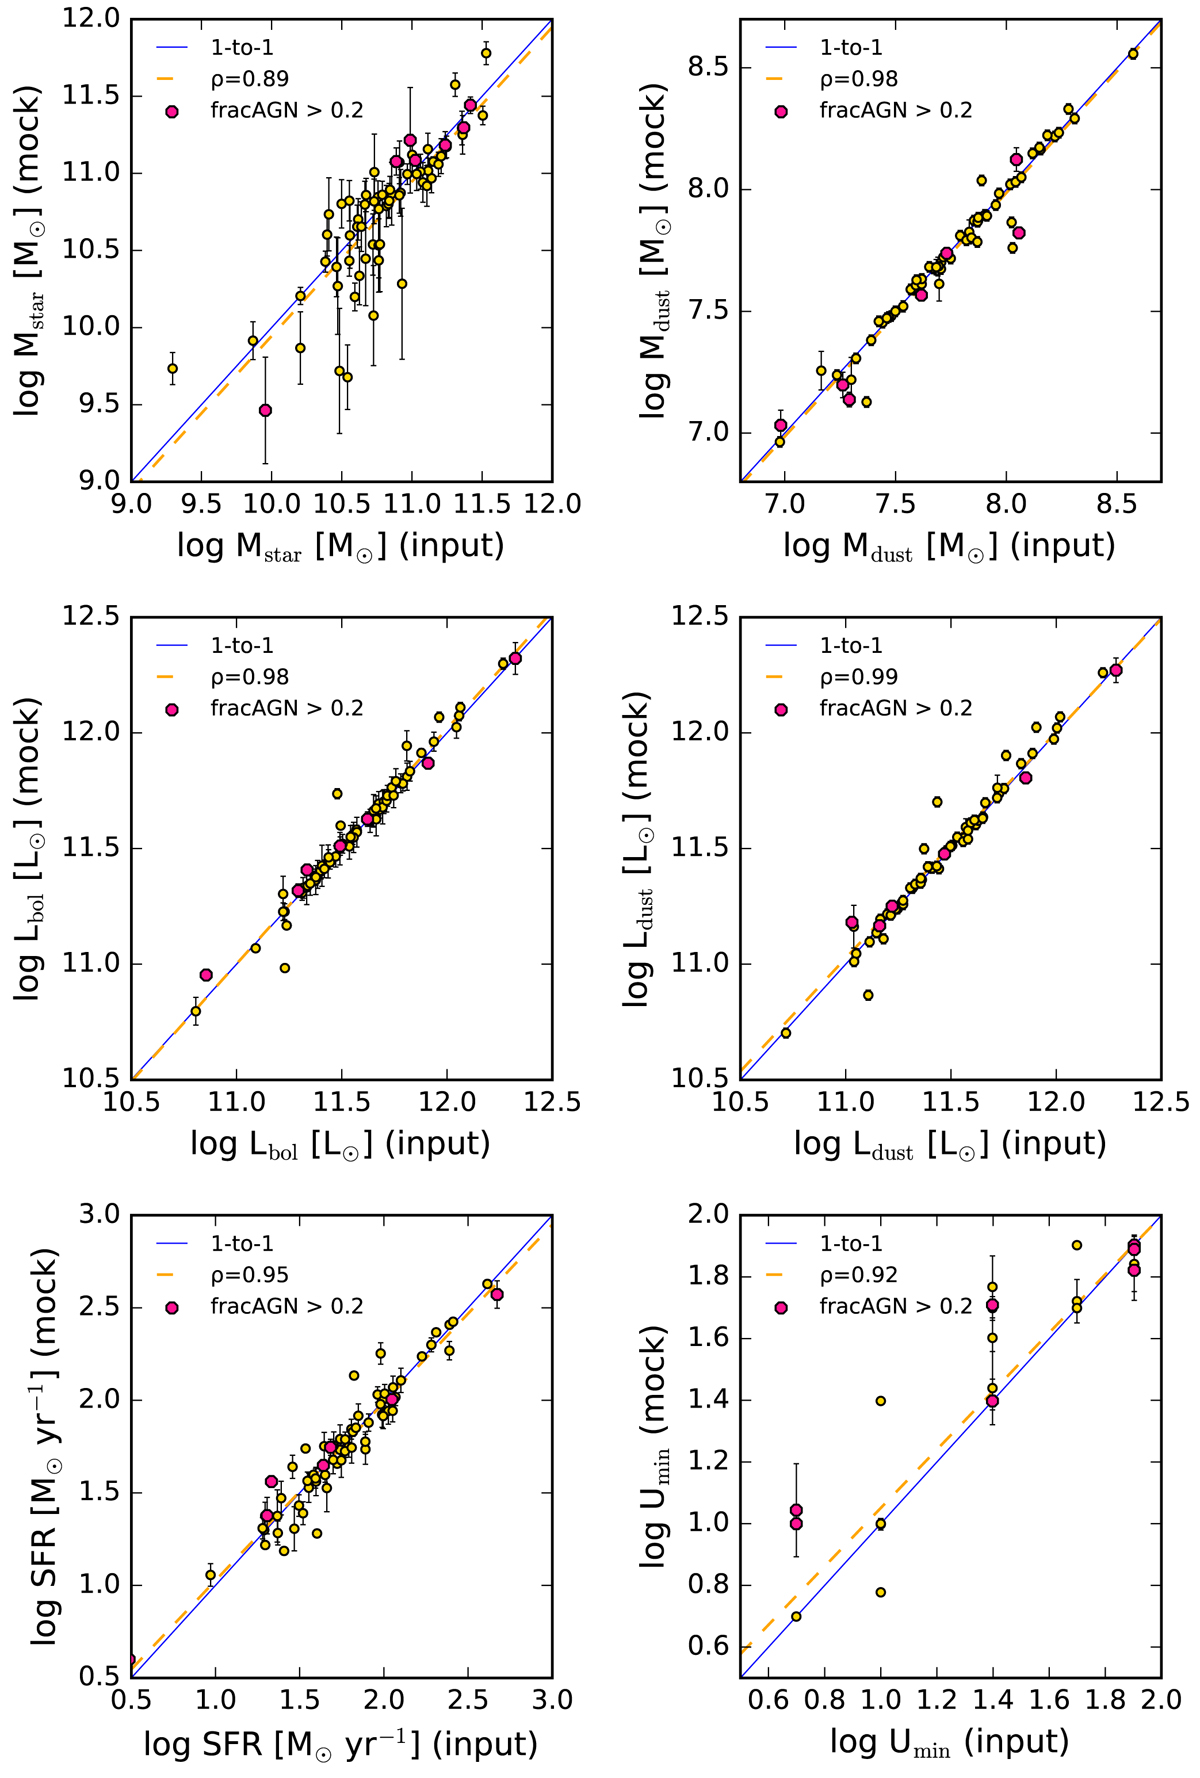
Best fitted parameters (input values; x-axis) versus the mock parameters (mock values; y-axis) as derived by the mock analysis performed with CIGALE. Each circle corresponds to an individual galaxy with the red circles indicating the strongest AGNs in the sample with fracAGN > 0.2. The solid blue line corresponds to the one-to-one relation, while the orange dashed line corresponds to the best linear fit to the data. The relevant value of the Spearman’s correlation coefficient (ρ) is also indicated in each panel.
Current usage metrics show cumulative count of Article Views (full-text article views including HTML views, PDF and ePub downloads, according to the available data) and Abstracts Views on Vision4Press platform.
Data correspond to usage on the plateform after 2015. The current usage metrics is available 48-96 hours after online publication and is updated daily on week days.
Initial download of the metrics may take a while.