Fig. 1.
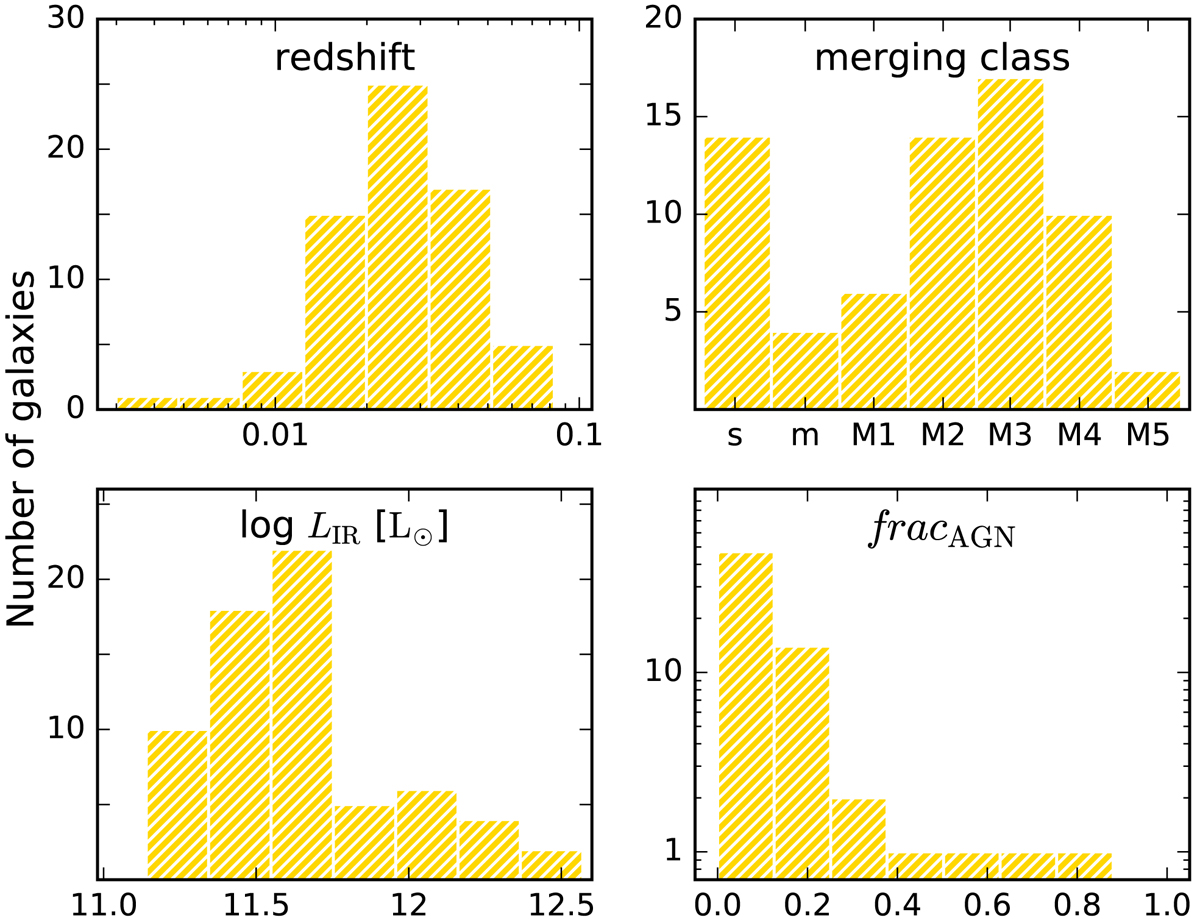
Distributions of the basic properties of our galaxy sample. The redshift distribution is plotted in the top-left panel and the number of sources per merging class is in the top-right panel. In the bottom-left panel, the IR luminosity distribution, based on IRAS observations (Sanders et al. 2003) is shown, while the bolometric AGN fractions calculated in Díaz-Santos et al. (2017) are plotted in the bottom-right panel.
Current usage metrics show cumulative count of Article Views (full-text article views including HTML views, PDF and ePub downloads, according to the available data) and Abstracts Views on Vision4Press platform.
Data correspond to usage on the plateform after 2015. The current usage metrics is available 48-96 hours after online publication and is updated daily on week days.
Initial download of the metrics may take a while.