Fig. 9
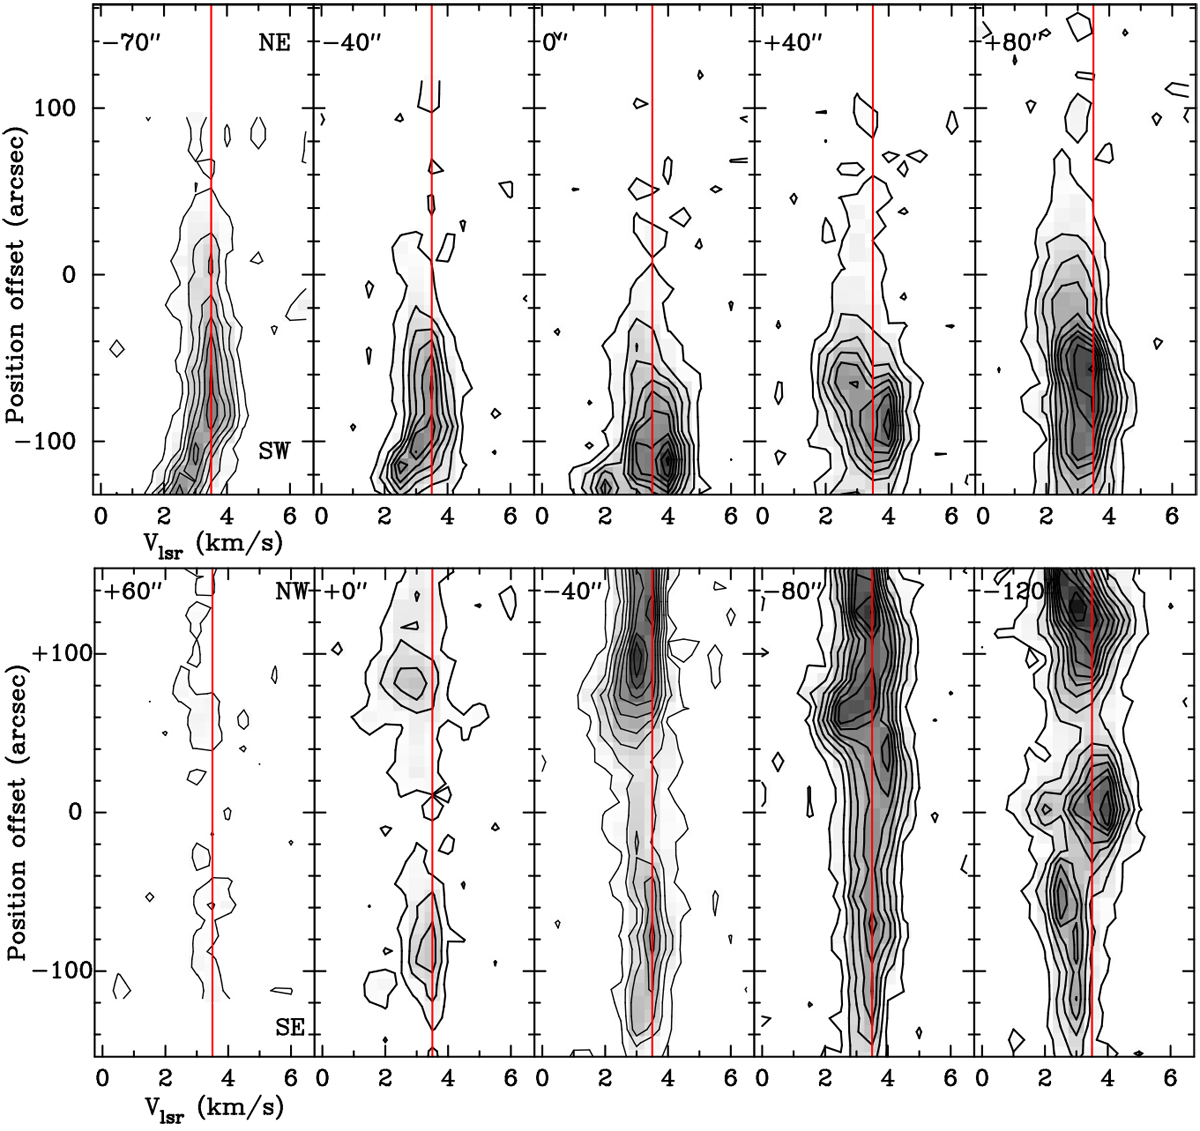
Position–velocity diagrams of HCO+(4–3) emission along parallel (top) and perpendicular (bottom) cuts shown in Fig. 6 and plotted in the same way as Figs. 7 and 8 using the same angular resolution as for [C II]. Ten linear contours from 0.3 to 6.9 K are shown, and the peak intensity is 7.0 K. To the NE, the HCO+ is barely detectable 60′′ from S 1, confirming that the density of the surrounding cloud falls off toward the NE. The southwestern most perpendicular position velocity cut 120′′ west of S 1 does not cross the PDR, but is plotted to illustrate that the emission in the Rho Oph A ridge is more blueshifted than the emission from the S 1 PDR.
Current usage metrics show cumulative count of Article Views (full-text article views including HTML views, PDF and ePub downloads, according to the available data) and Abstracts Views on Vision4Press platform.
Data correspond to usage on the plateform after 2015. The current usage metrics is available 48-96 hours after online publication and is updated daily on week days.
Initial download of the metrics may take a while.