Fig. 7
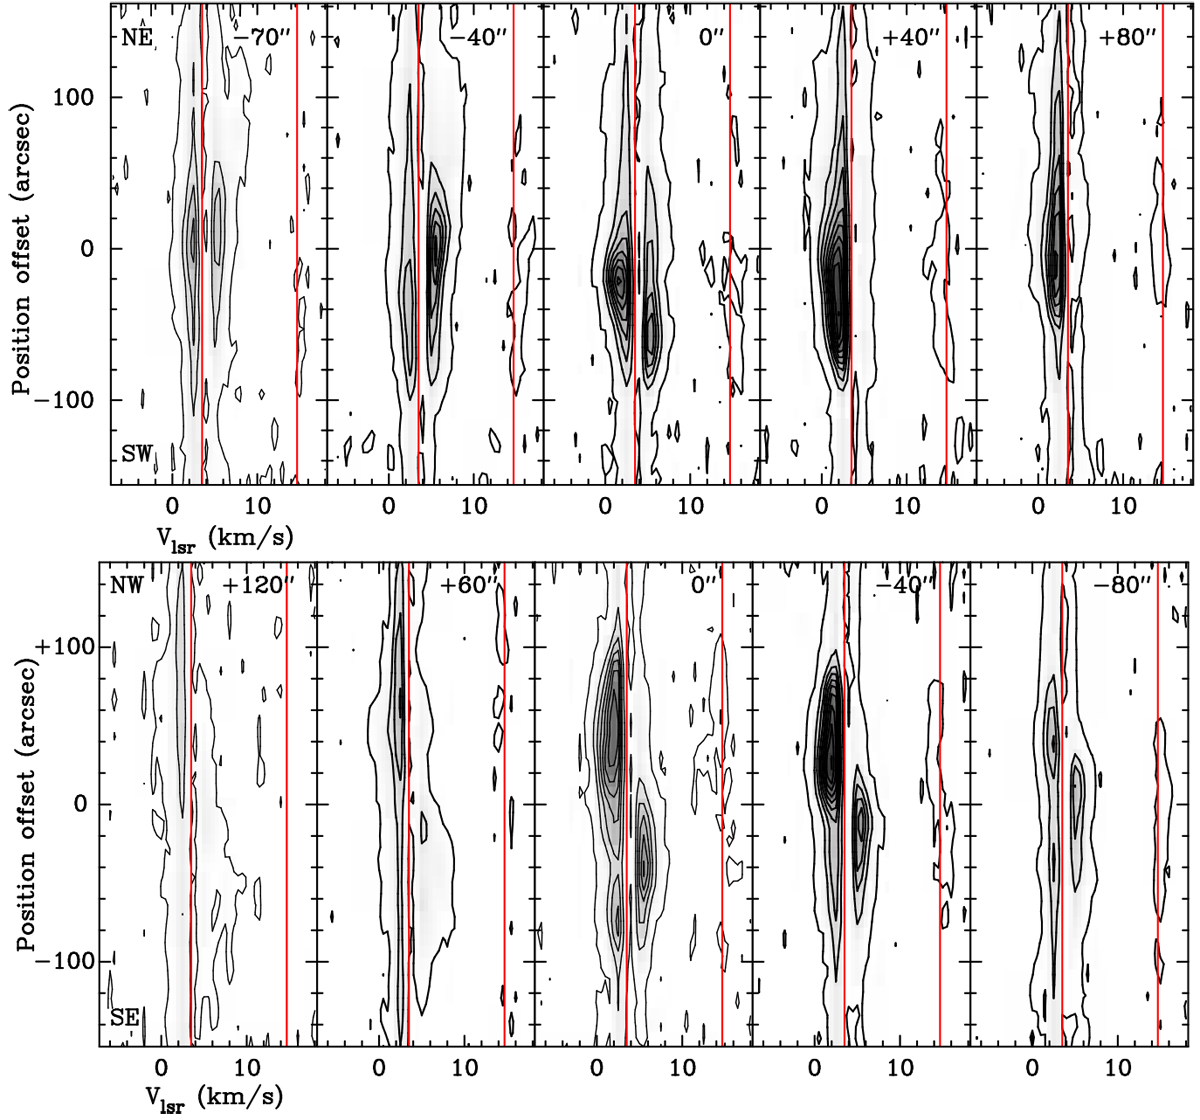
Position–velocity diagrams of [C II] emission along the parallel (top) and perpendicular (bottom) cuts shown in Fig. 6. The angular resolution is 18′′. The two red vertical lines mark the vlsr = +3.5 km s−1 for [C II] and the [13C II] F = 2–1 hyperfine line, which is offset by +11.2 km s−1 in the rest frame of [C II], or +14.7 km s−1. The contour levels are plotted with a linear step size and enhanced with a gray scale from 1 K to 1.25 times the peak temperature. For the parallel cuts, 10 contours from 1 to 73 K with the peak temperature at 73.1 K are shown. The contour levels for the perpendicular pv-plots are ten linear contours from 1 to 76 K and gray scale from 1 to 96 K. Offsets are relative to S 1, which is at 0′′. The parallelcuts extend from the NE to the SW starting from the south. The perpendicular cuts extend from the NW to the SE and start east of S 1.
Current usage metrics show cumulative count of Article Views (full-text article views including HTML views, PDF and ePub downloads, according to the available data) and Abstracts Views on Vision4Press platform.
Data correspond to usage on the plateform after 2015. The current usage metrics is available 48-96 hours after online publication and is updated daily on week days.
Initial download of the metrics may take a while.