Fig. 6
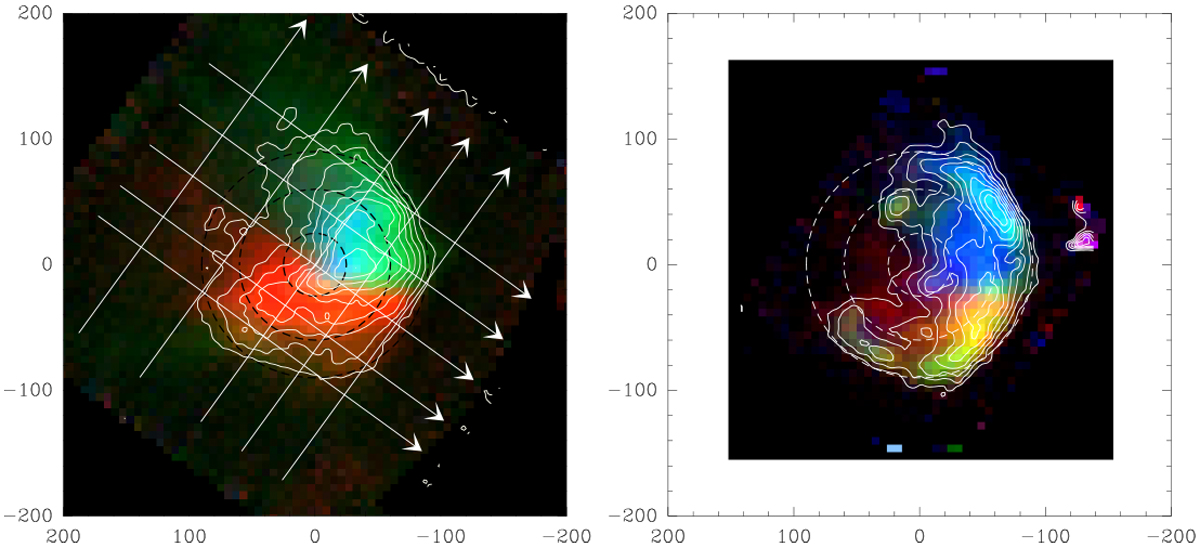
Three-color composite images showing the [C II] and [O I] 145 μm emission in different velocity channels. The orthogonal sets of lines show the cuts along which the position-velocity diagrams are derived. Left: [C II] emission in velocity interval υLSR = −0.5–1, 1.5–3, and 4.5–7 km s−1 shown as blue, green, and red channels, respectively. The contours show the [C II] emission in the velocity interval −0.5–7 km s−1. Right: [O I] 145 μm emission in the velocity intervals υLSR = 1–2.5, 3–4, and 4–5.5 km s−1 as blue, green, and red channels, respectively. The contours show the [O I] 145 μm emission in the velocity interval 1–5.5 km s−1.
Current usage metrics show cumulative count of Article Views (full-text article views including HTML views, PDF and ePub downloads, according to the available data) and Abstracts Views on Vision4Press platform.
Data correspond to usage on the plateform after 2015. The current usage metrics is available 48-96 hours after online publication and is updated daily on week days.
Initial download of the metrics may take a while.