Fig. 4
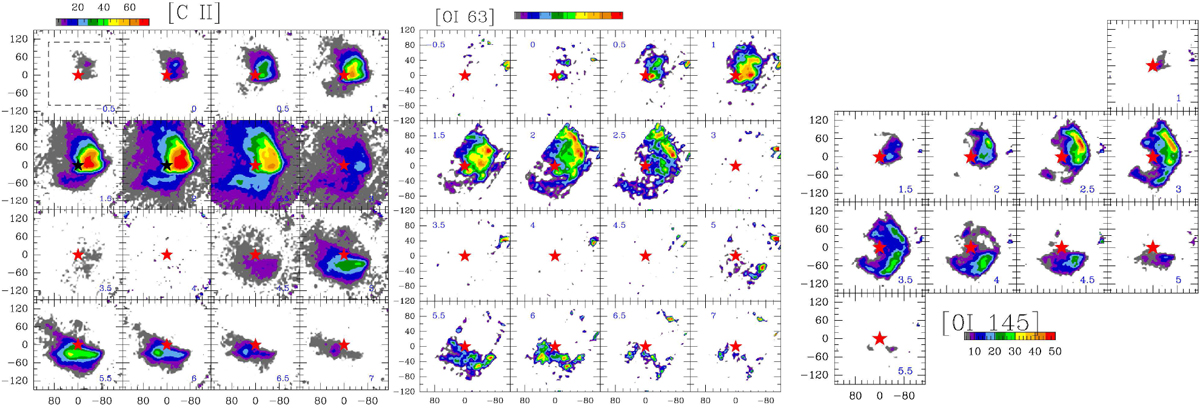
Channel maps of [C II] (left), [O I] 63 μm (middle), and [O I] 145μm (right). The color scale for each map is shown next to the map. Velocities corresponding to the channel are marked in each panel. The red star marks the position of S 1. The positional offsets (in arcseconds) are relative to the center α = 16h26m34. s175, δ = − 24° 23′ 28.′′3 (J2000). The area mapped in CO(6–5) is shown with dashed boundaries in the top left panel of the [C II] channel map.
Current usage metrics show cumulative count of Article Views (full-text article views including HTML views, PDF and ePub downloads, according to the available data) and Abstracts Views on Vision4Press platform.
Data correspond to usage on the plateform after 2015. The current usage metrics is available 48-96 hours after online publication and is updated daily on week days.
Initial download of the metrics may take a while.