Fig. 3
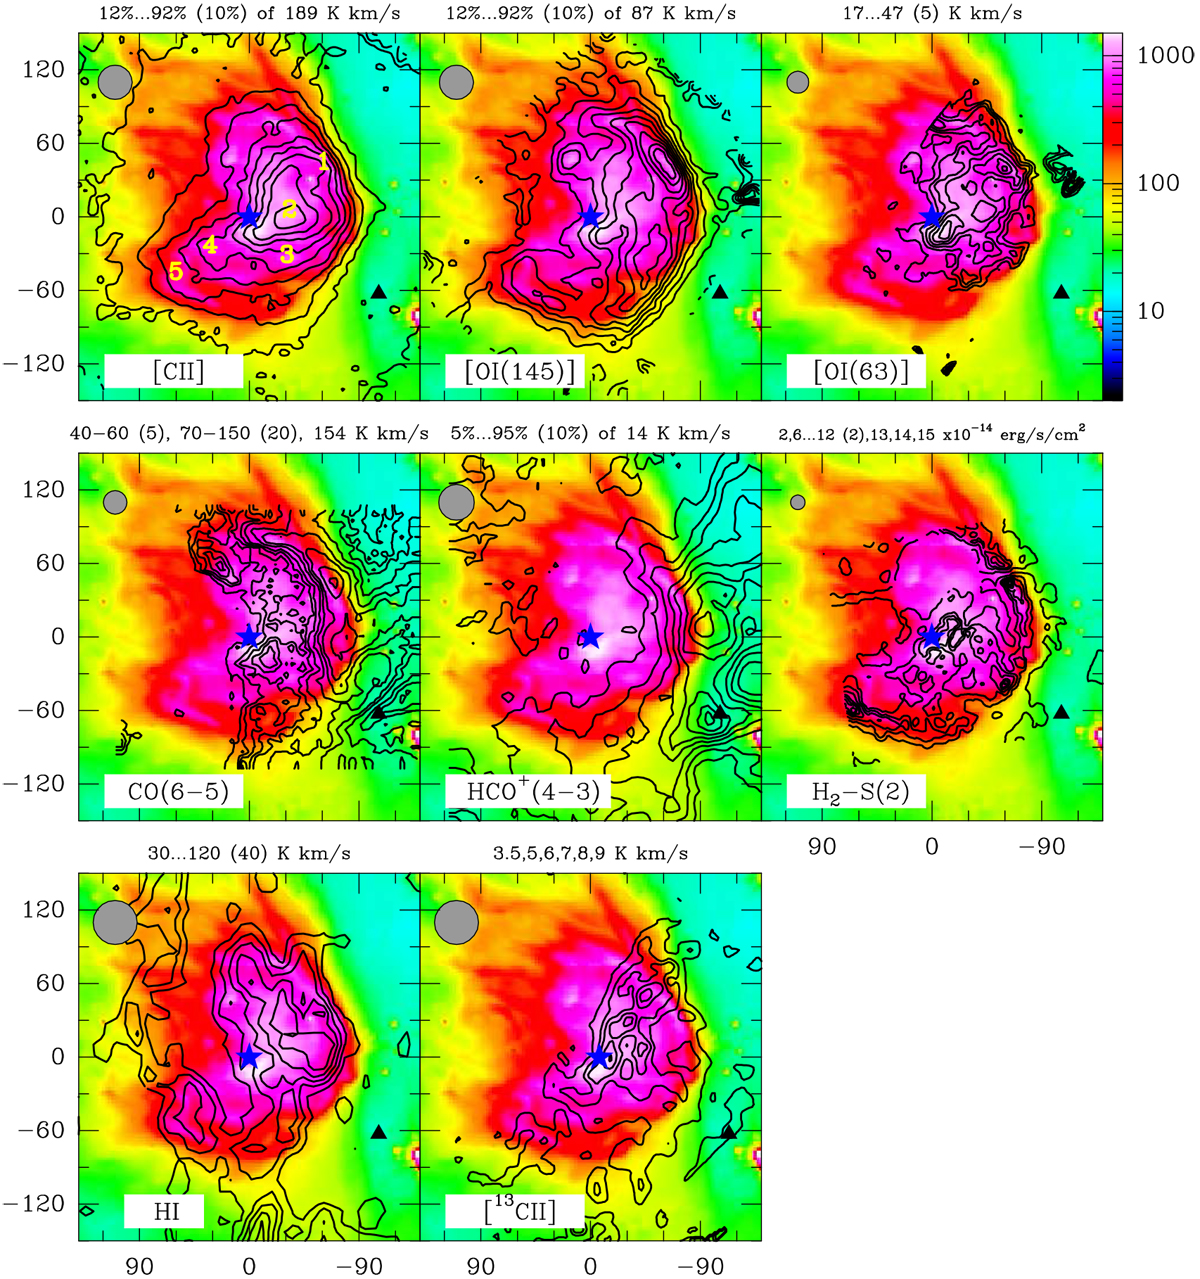
Comparison of the 8 μm continuum image observed with IRAC/Spitzer (color) with contours of integrated intensity images of tracers (marked) overlaid on the 8 μm continuum image observed with IRAC/Spitzer. The color scale is shown in the wedge to the right of the top row, with numbers in units of MJy/sr. For each of the tracers shown as contours, levels are shown at the top of the panel and beams are shown in the top left corner of each panel. The range of velocities over which integrations were made are as follows: [C II] −0.5 to 7.5 km s−1, [O I] 145 μm 1 to 5.5 km s−1, [O I] 63 μm 0.5 to 6.5 km s−1, H I −0.5 to 5 km s−1, CO(6–5) 0 to 10 km s−1, HCO+ (4–3) 0 to 10 km s−1, and [13 C II] F = 2–1 1 to 5 km s−1. The positional offsets are relative to the center α = 16h26m34. s175, δ = − 24° 23′ 28.′′3 (J2000). The asterisk and the triangle mark the positions of S 1 and VLA 1623, respectively. The numbers in the top left panel mark selected positions that are studied in detail. The offsets for the positions in arc seconds are 1(−61,45), 2(−33,6), 3(−31,−31), 4(32,−23), and 5(60,−45).
Current usage metrics show cumulative count of Article Views (full-text article views including HTML views, PDF and ePub downloads, according to the available data) and Abstracts Views on Vision4Press platform.
Data correspond to usage on the plateform after 2015. The current usage metrics is available 48-96 hours after online publication and is updated daily on week days.
Initial download of the metrics may take a while.