Fig. 15
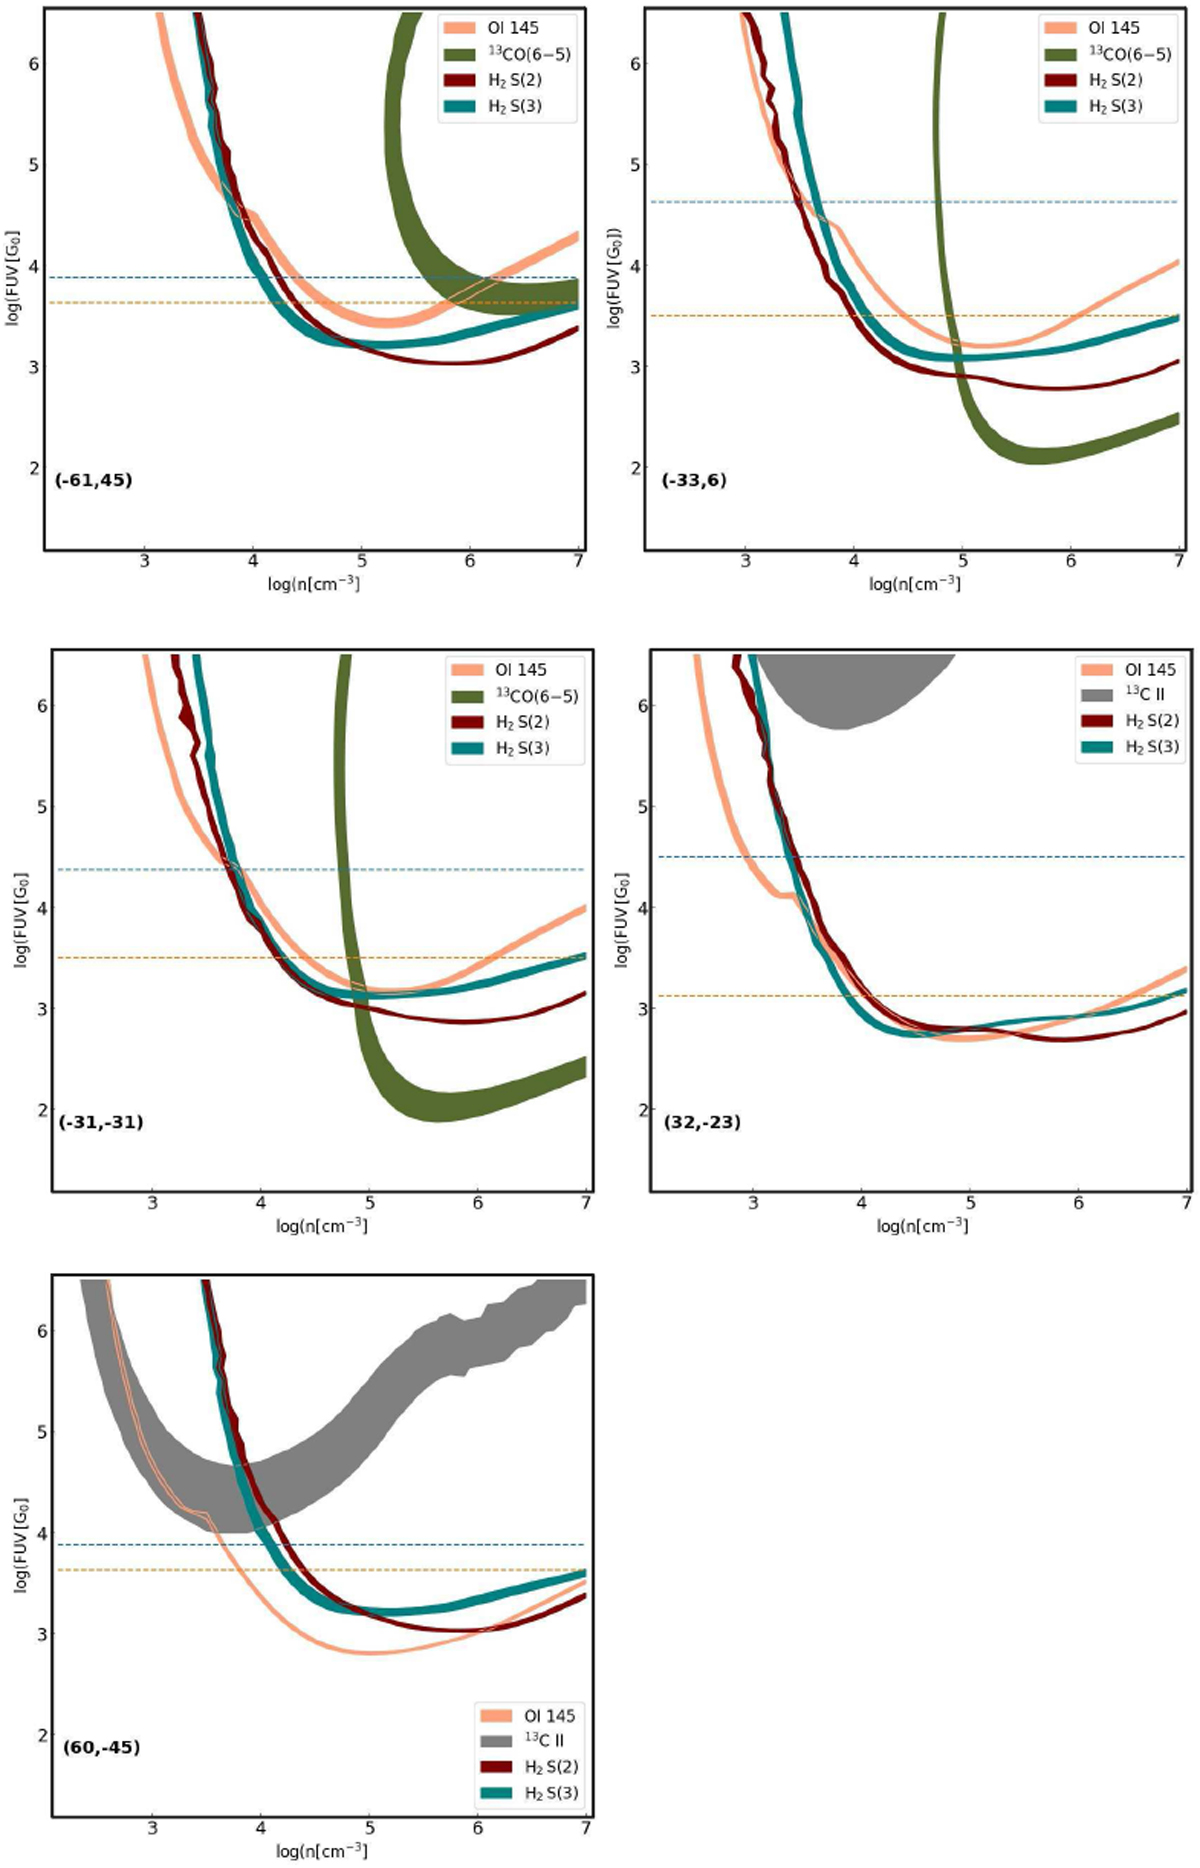
Comparison of observations with the prediction of line intensities as a function of nH and G0 from an updated version of the Kaufman et al. (2006) PDR models (Wolfire, priv. comm.). For all positions except for (32,−23) and (60,−45), the [13 C II] intensities are beyond the values predicted by the models. The horizontal dashed lines correspond to the values of G0 estimated from the FIR intensities (lower) and from the stellar FUV radiation scaled only by geometrical dilution due to the increase in distance from S 1.
Current usage metrics show cumulative count of Article Views (full-text article views including HTML views, PDF and ePub downloads, according to the available data) and Abstracts Views on Vision4Press platform.
Data correspond to usage on the plateform after 2015. The current usage metrics is available 48-96 hours after online publication and is updated daily on week days.
Initial download of the metrics may take a while.