Fig. 14
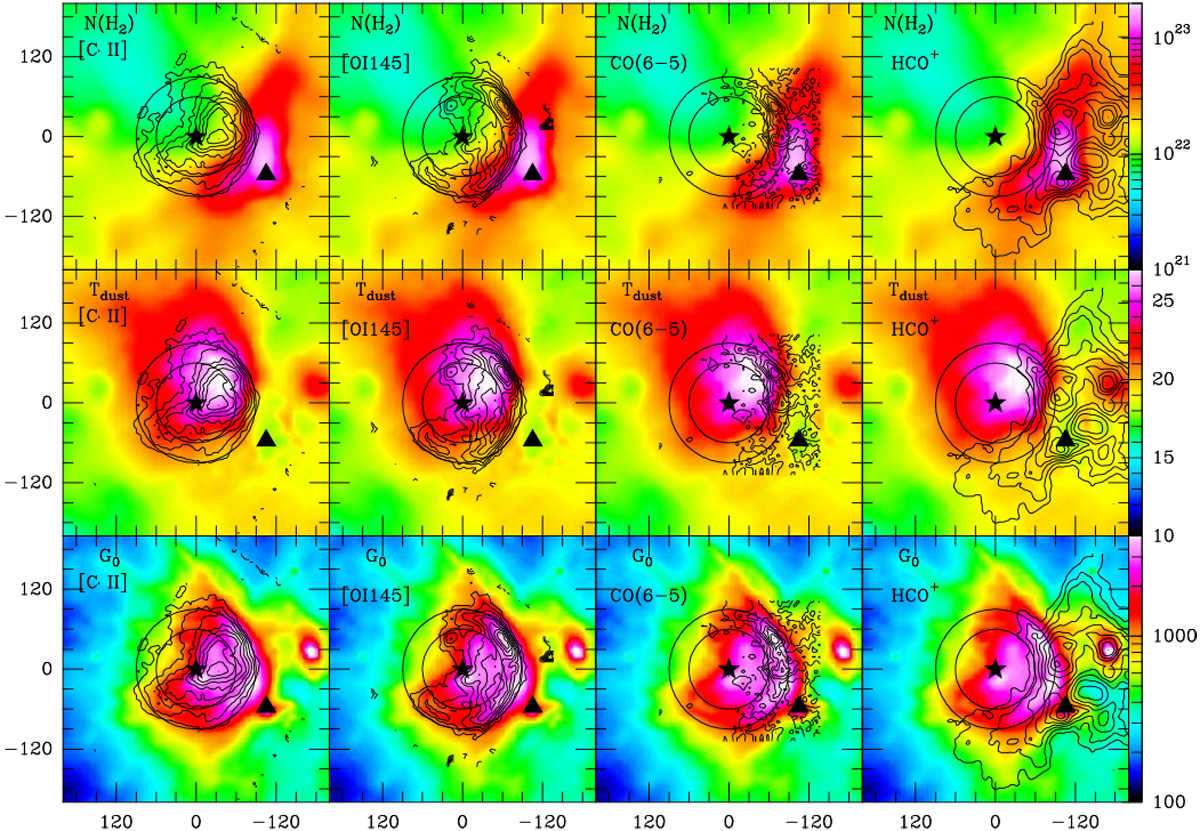
Comparison of distribution of [C II], [O I] 145 μm, CO(6–5), and HCO+ (4–3) emission and the column density, dust temperature, and FUV intensities estimated from PACS continuum data observed as part of Herschel Gould Belt Survey. The color scales are shown at the far right of each row of panels. The contour levels for [C II], [O I] 145 μm, and HCO+ (4–3) are at 20–100% (in steps of 10%) of the peak values of 191, 88, and 14 Kkm s−1 respectively. For CO(6–5)the contours are at 40–100% of the peak of 136 km s−1. Circles correspond to radii of 45′′ and 75′′.
Current usage metrics show cumulative count of Article Views (full-text article views including HTML views, PDF and ePub downloads, according to the available data) and Abstracts Views on Vision4Press platform.
Data correspond to usage on the plateform after 2015. The current usage metrics is available 48-96 hours after online publication and is updated daily on week days.
Initial download of the metrics may take a while.