Fig. 13
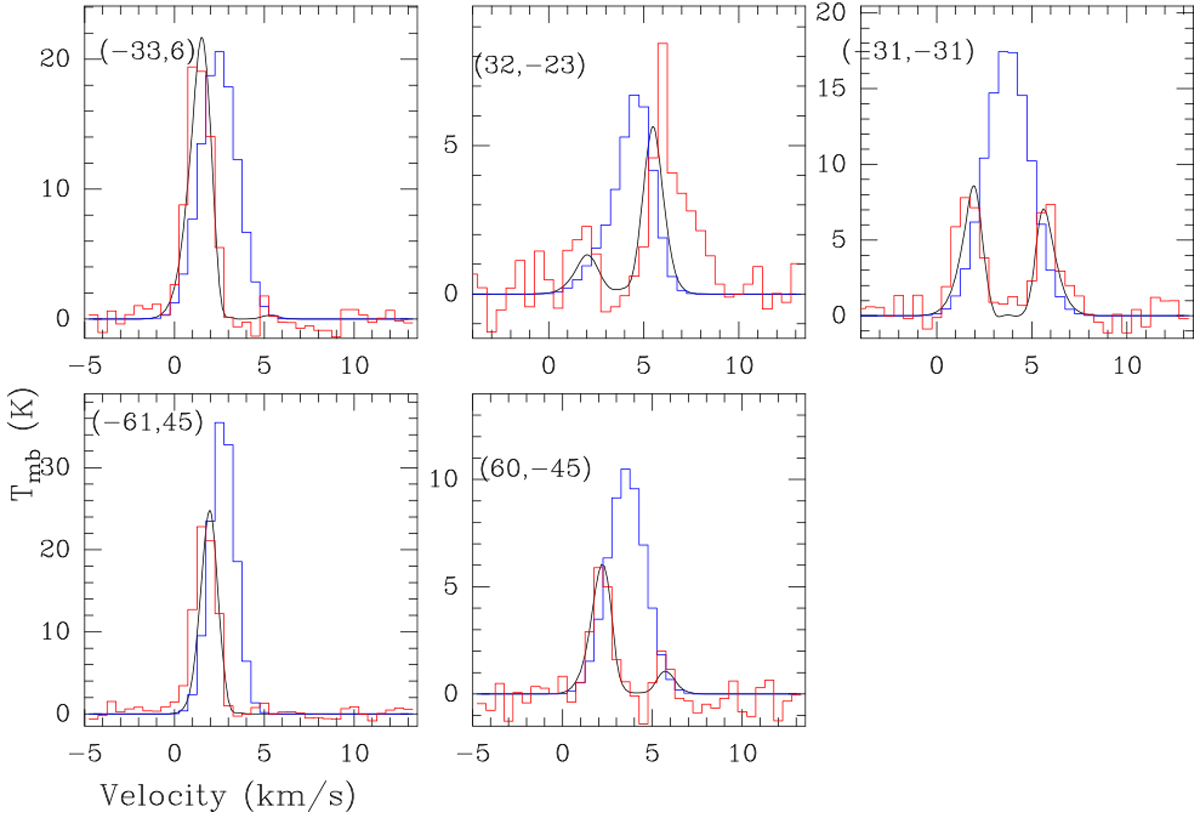
Comparison of [O I] 63 (red) and [O I] 145 μm (blue) spectra coadded over 14′′ with centers at offsets shown in the panels. The smooth curve (black) shows the fit to the [O I] 63 spectrum obtained by attenuating the scaled (by a factor 2 corresponding to the typical ratio between the two [O I] lines in temperature units) [O I] 145 μm spectrum by absorption due to foreground material.
Current usage metrics show cumulative count of Article Views (full-text article views including HTML views, PDF and ePub downloads, according to the available data) and Abstracts Views on Vision4Press platform.
Data correspond to usage on the plateform after 2015. The current usage metrics is available 48-96 hours after online publication and is updated daily on week days.
Initial download of the metrics may take a while.