Free Access
Fig. 11
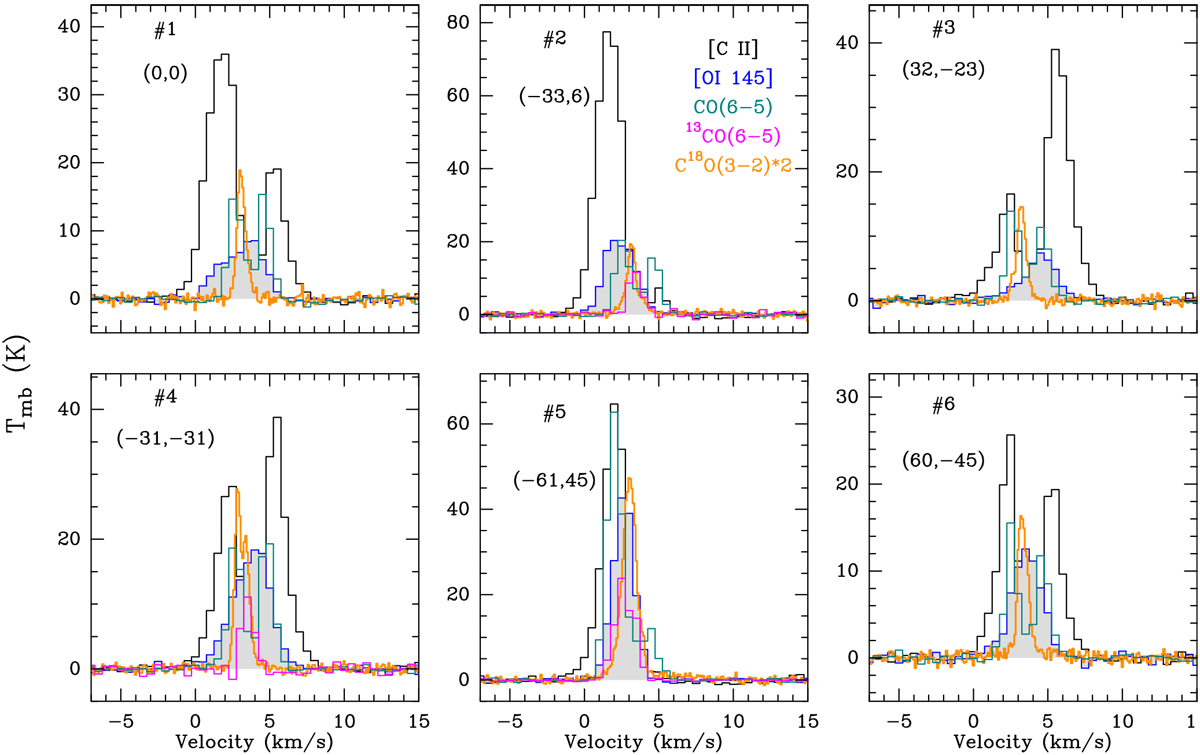
Comparison of spectra of [C II], [O I], C18O(3–2), CO(6–5), and 13CO(6–5) transitions at the selected positions. The positions are shown in Fig. 3. The data set corresponding to the C18 O(3–2) spectra shown here was presented by Mookerjea et al. (2018). All spectra have been coadded across a 20′′ field.
Current usage metrics show cumulative count of Article Views (full-text article views including HTML views, PDF and ePub downloads, according to the available data) and Abstracts Views on Vision4Press platform.
Data correspond to usage on the plateform after 2015. The current usage metrics is available 48-96 hours after online publication and is updated daily on week days.
Initial download of the metrics may take a while.