Fig. 10
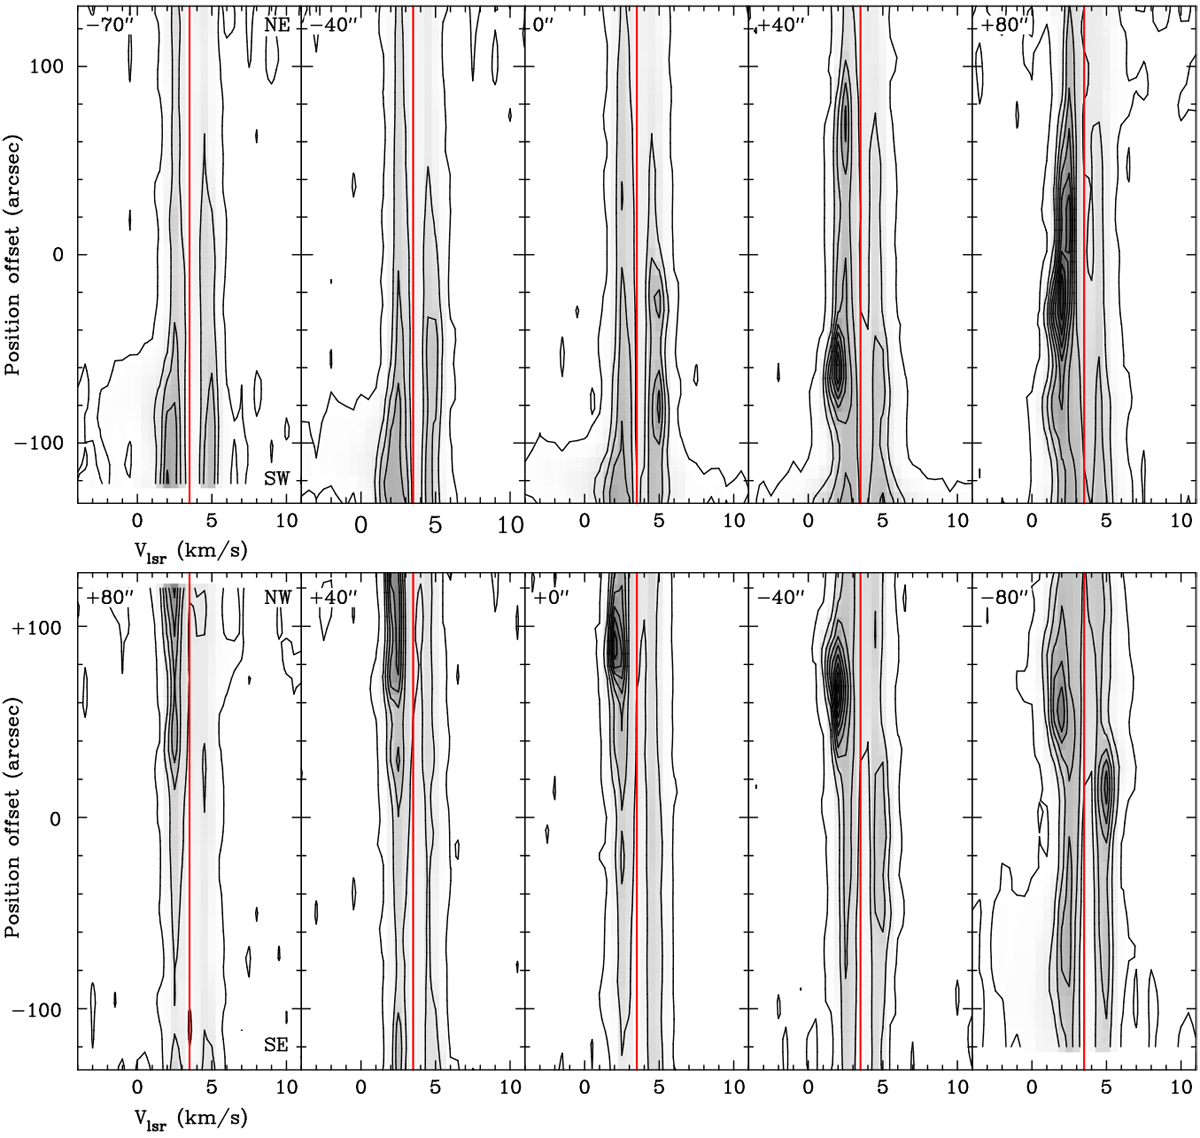
Position–velocity diagrams of CO(6–5) emission along parallel (top) and perpendicular (bottom) cuts shown in Fig. 6 and plotted in the same way as Figs. 7 and 8using thesame angular resolution as for [C II]. Ten linear contours from 0.8 to 68 K are shown, and the gray scale extends from 0.8 to 85 K. In the parallel cuts, red- and blueshifted emission from the VLA 1623 outflow in the SW is observed. The blueshifted outflow lobe in the SE is detected in the perpendicular cut 80′′ from S 1. This bipolar outflow is unrelated to the S 1 PDR. There is no evidence for PDR emission in the perpendicular cut 80′′ NE of S 1. The CO(6–5) emission is faint and most likely comes from the surrounding molecular cloud.
Current usage metrics show cumulative count of Article Views (full-text article views including HTML views, PDF and ePub downloads, according to the available data) and Abstracts Views on Vision4Press platform.
Data correspond to usage on the plateform after 2015. The current usage metrics is available 48-96 hours after online publication and is updated daily on week days.
Initial download of the metrics may take a while.