Fig. 9
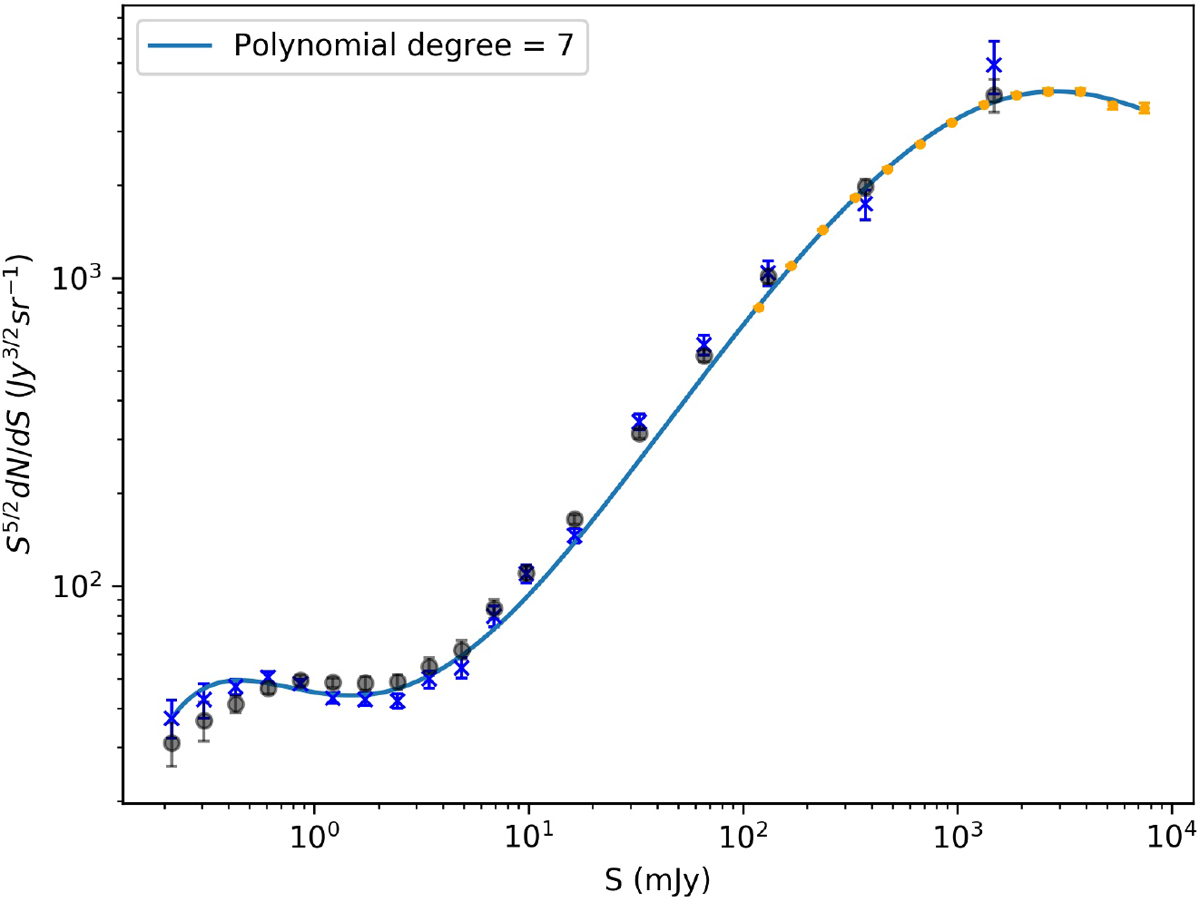
150 MHz Euclidean normalized differential source counts as derived from the LoTSS Deep Fields: raw catalog are indicated by transparent black circles and final catalog by blue crosses. Also shown are the counts obtained from the TGSS-ADR1 (Intema et al. 2017, orange filled circles), which better describe the counts’ bright end. Over-plotted is the best fit obtained by modeling the counts in the log–log space with a 7th order polynomial function, according to Eq. (13) (see Table 4 for the values of the best-fit coefficients and associated errors).
Current usage metrics show cumulative count of Article Views (full-text article views including HTML views, PDF and ePub downloads, according to the available data) and Abstracts Views on Vision4Press platform.
Data correspond to usage on the plateform after 2015. The current usage metrics is available 48-96 hours after online publication and is updated daily on week days.
Initial download of the metrics may take a while.