Fig. 8
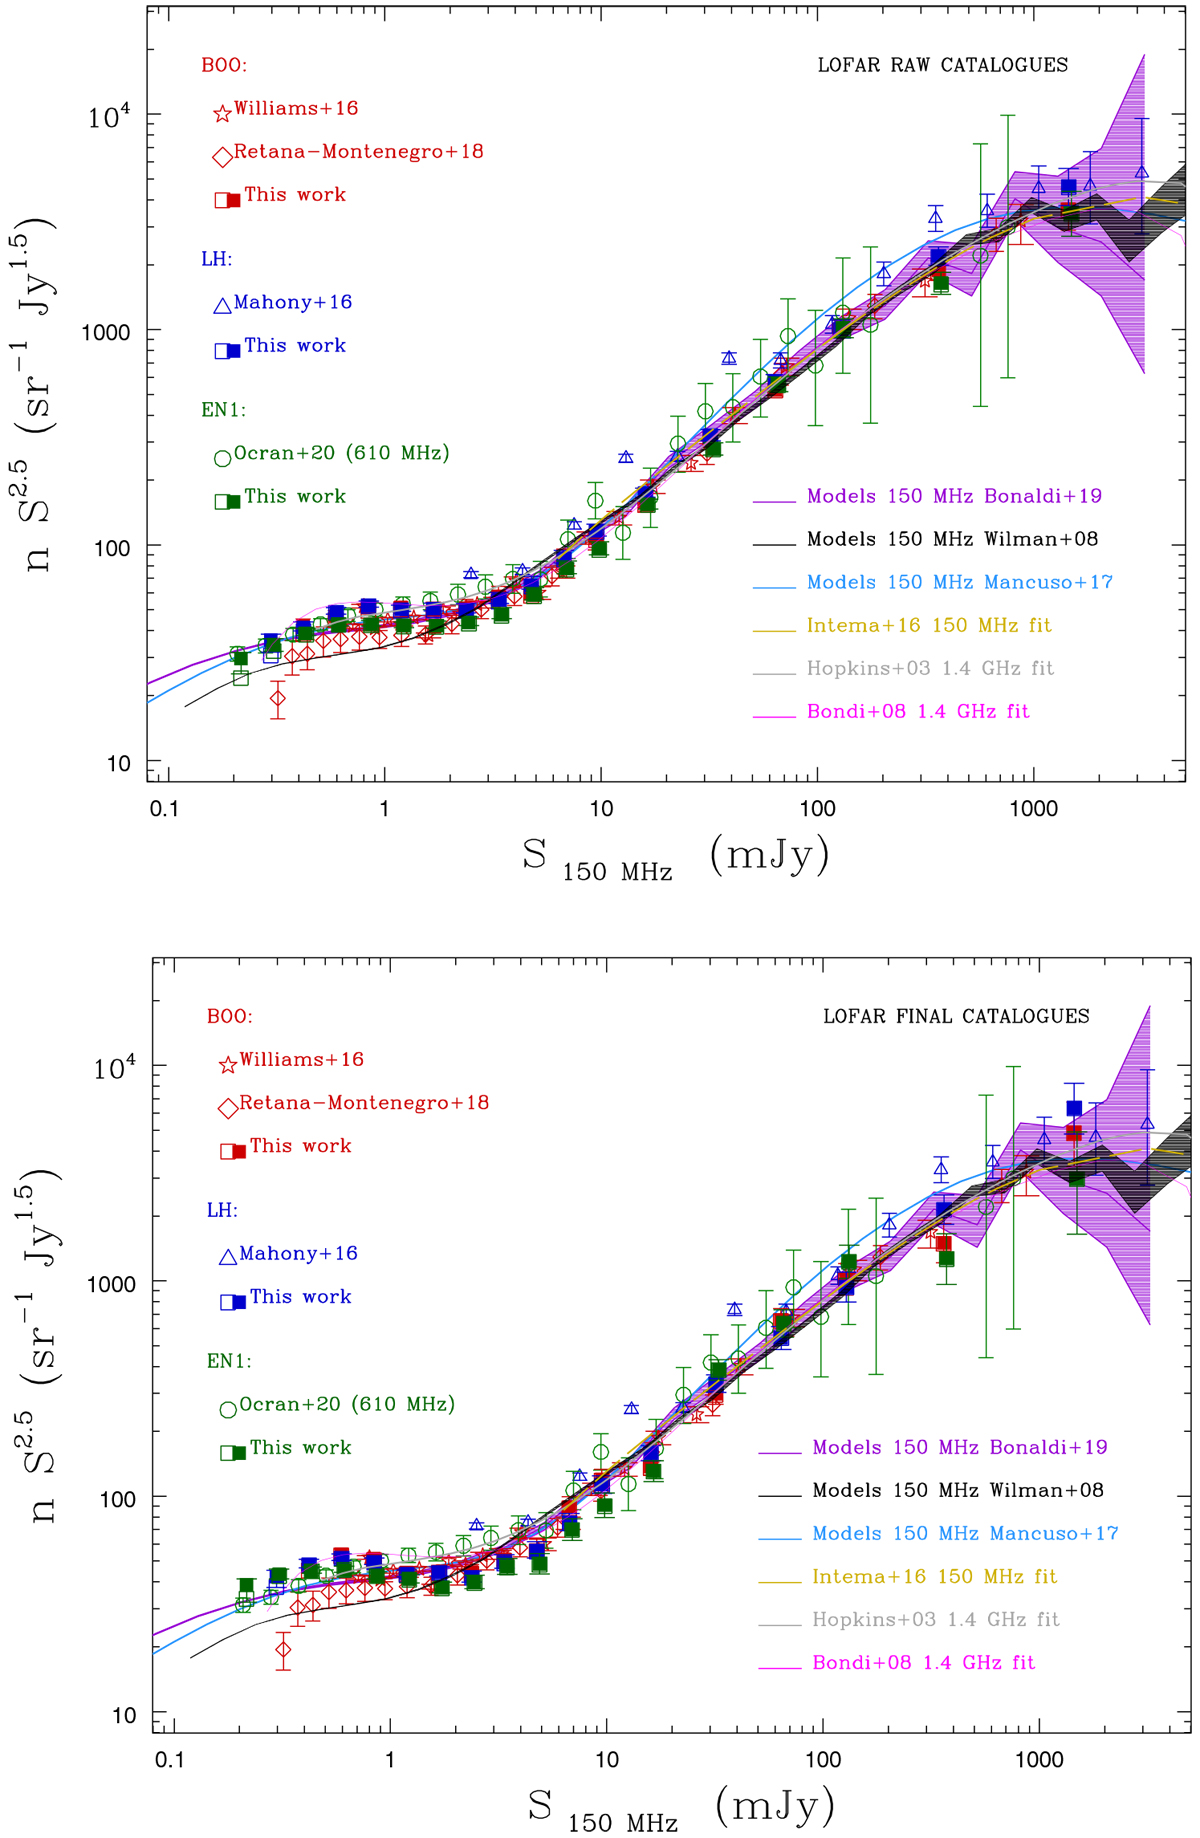
Normalized 150 MHz differential source counts in the three LoTSS Deep Fields, as derived from raw (top) and final (bottom) catalogs (filled squares). Error bars correspond to the quadratic sum of Poisson and systematic errors. Also shown are the counts obtained without applying the corrections discussed in Sects. 4 and 5 (empty squares). The counts are derived by using total flux densities for both point and extended sources. In both figures, Wilman et al. (2008), Bonaldi et al. (2019) and Mancuso et al. (2017) 150 MHz models are shown for comparison, as well as other existing 150 MHz counts’ determinations in the same fields (see legend). Since published 150 MHz counts are missing for EN1, we show a recent determination obtained at 610 MHz (Ocran et al. 2020) and rescaled to 150 MHz, assuming α = − 0.7. Also shown are the counts’ best fits discussed in Sect. 5.
Current usage metrics show cumulative count of Article Views (full-text article views including HTML views, PDF and ePub downloads, according to the available data) and Abstracts Views on Vision4Press platform.
Data correspond to usage on the plateform after 2015. The current usage metrics is available 48-96 hours after online publication and is updated daily on week days.
Initial download of the metrics may take a while.