Fig. 7
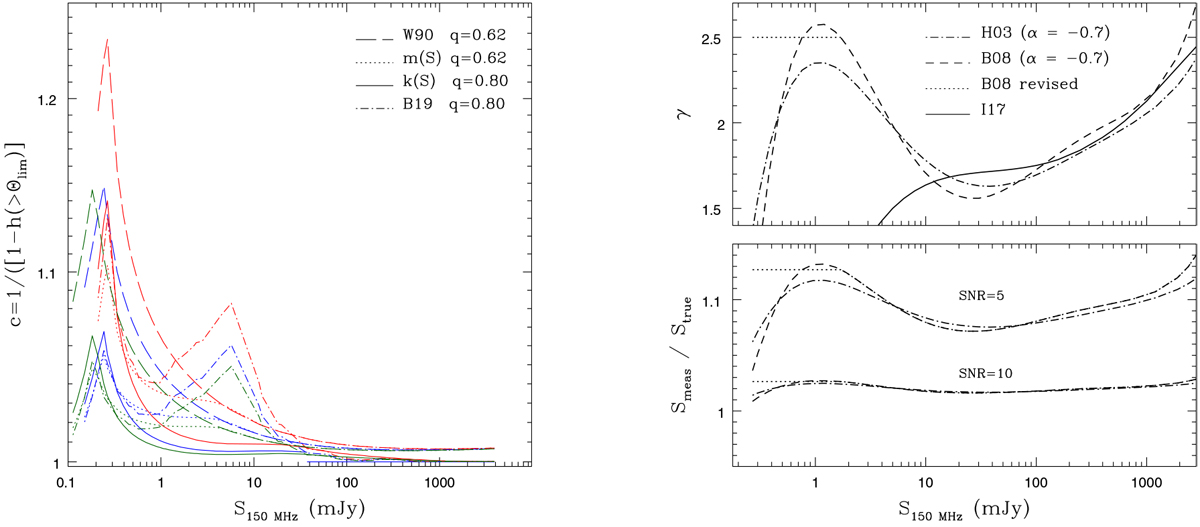
Left: flux-dependent correction to be applied to source counts to account for incompleteness due to resolution bias, for four median size - flux relations: the one derived from the simulated T-RECS catalogs (Bonaldi et al. 2019; dot-dashed lines), the one proposed by Windhorst et al. (1990, long-dashed lines), the revised version with m = m(S), which betterdescribe source sizes at 1.4 GHz sub-mJy fluxes (see Eq. (8), dotted lines), and the revised version with k = k(S) proposed by us (Eq. (9), solid lines). We also vary the q exponent of the integral distribution function. Based on our analysis of the source size distribution (see Fig. 6 and related discussion), we assume the original value proposed by Windhorst et al. (1990, q = 0.62) for the Windhorst et al. (1990) median size – flux relation and for the revised version with m = m(S). We assume asteeper q = 0.80 for the revised version with k = k(S) and for the Bonaldi et al. (2019) relation (see legenda). Different colors refer to different fields: LH (blue), Boo (red), EN1 (green). The corrections account for noise variations in the masked images through an empirical relation between source flux and source signal-to-noise ratio, calibrated for each field (we assume here the median noise of the masked images; see last column of Table 1). Right: Eddington bias for different underlying number-count distributions, as illustrated in the top panel: source counts’ slope (γ; d N∕d S ~ S−γ) derived from the sixth-order polynomial fit proposed at 1.4 GHz by (a) Hopkins et al. (2003; dot-dashed line) and (b) Bondi et al. (2008; dashed line), both converted to 150 MHz assuming a spectral index α = − 0.7; we also show a revised version of the Bondi et al. (2008) fit, which assumes a constant Euclidean slope (γ = 2.5) from 2 mJy all the way down to 0.1 mJy (dotted line). The polynomial fit proposed by Intema et al. (2017) at 150 MHz and valid only for the bright end of the counts is also shown for reference (solid line). The flux boosting (Smeas ∕Strue) corresponding to the three cases illustrated above is shown in the bottom panel for two different source signal-to-noise ratios: S∕N = 5 and S∕N = 10.
Current usage metrics show cumulative count of Article Views (full-text article views including HTML views, PDF and ePub downloads, according to the available data) and Abstracts Views on Vision4Press platform.
Data correspond to usage on the plateform after 2015. The current usage metrics is available 48-96 hours after online publication and is updated daily on week days.
Initial download of the metrics may take a while.