Fig. 6
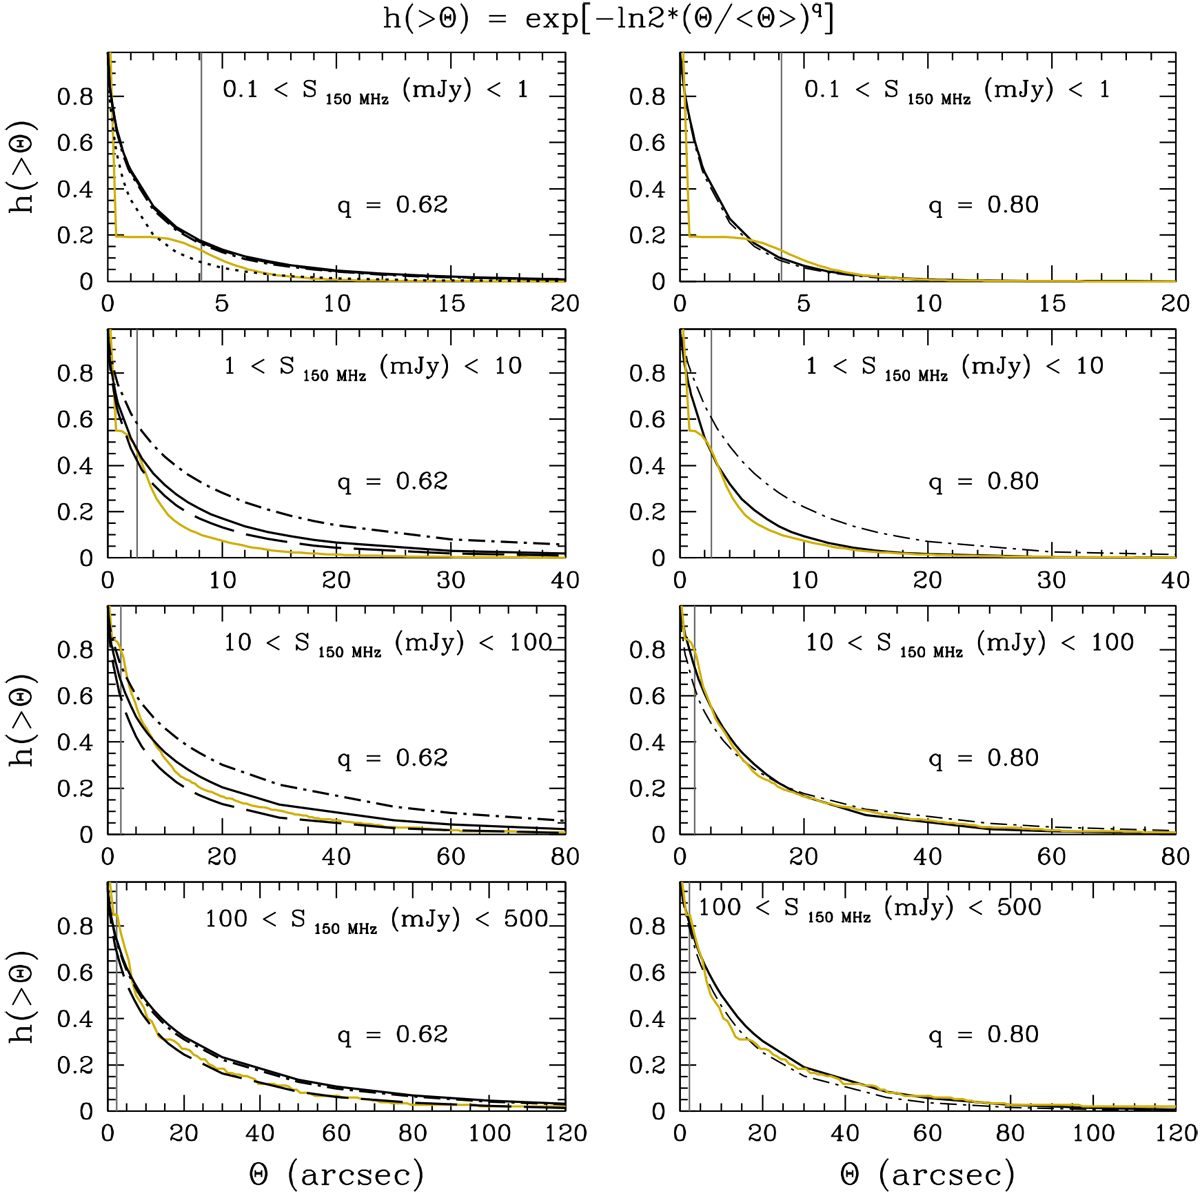
Source size cumulative distribution of final catalogs (yellow solid line) in four 150 MHz flux density bins (top to bottom). The vertical gray lines in all panels provides an approximate indication of the minimum intrinsic angular size to which the observed distributions can be considered reliable (most of the sources below this line cannot be reliably deconvolved and they are conventionally assigned Θ = 0). Also shown for comparison are various realizations of the cumulative distribution function described by Eq. (6). The two columns correspond to two different values for the function exponent q: the original one proposed by Windhorst et al. (1990) (q = 0.62) on the left, and a steeper one (q = 0.80) on the right. In addition we also vary the median size – flux relation. In particular we assume the original Windhorst et al. (1990) relation (black long-dashed line), the revised versions with flux-dependent m and k parameters, as described by Eqs. (8) and (9) (black dotted and solid lines respectively) and the one describing the T-RECS catalogs (Bonaldi et al. 2019; black dot-dashed line). All such realizations are shown on the left; on the right we only show the realizations obtained using the Bonaldi et al. (2019) and the revised Windhorst et al. (1990) k = k(S) relations.
Current usage metrics show cumulative count of Article Views (full-text article views including HTML views, PDF and ePub downloads, according to the available data) and Abstracts Views on Vision4Press platform.
Data correspond to usage on the plateform after 2015. The current usage metrics is available 48-96 hours after online publication and is updated daily on week days.
Initial download of the metrics may take a while.