Fig. 3
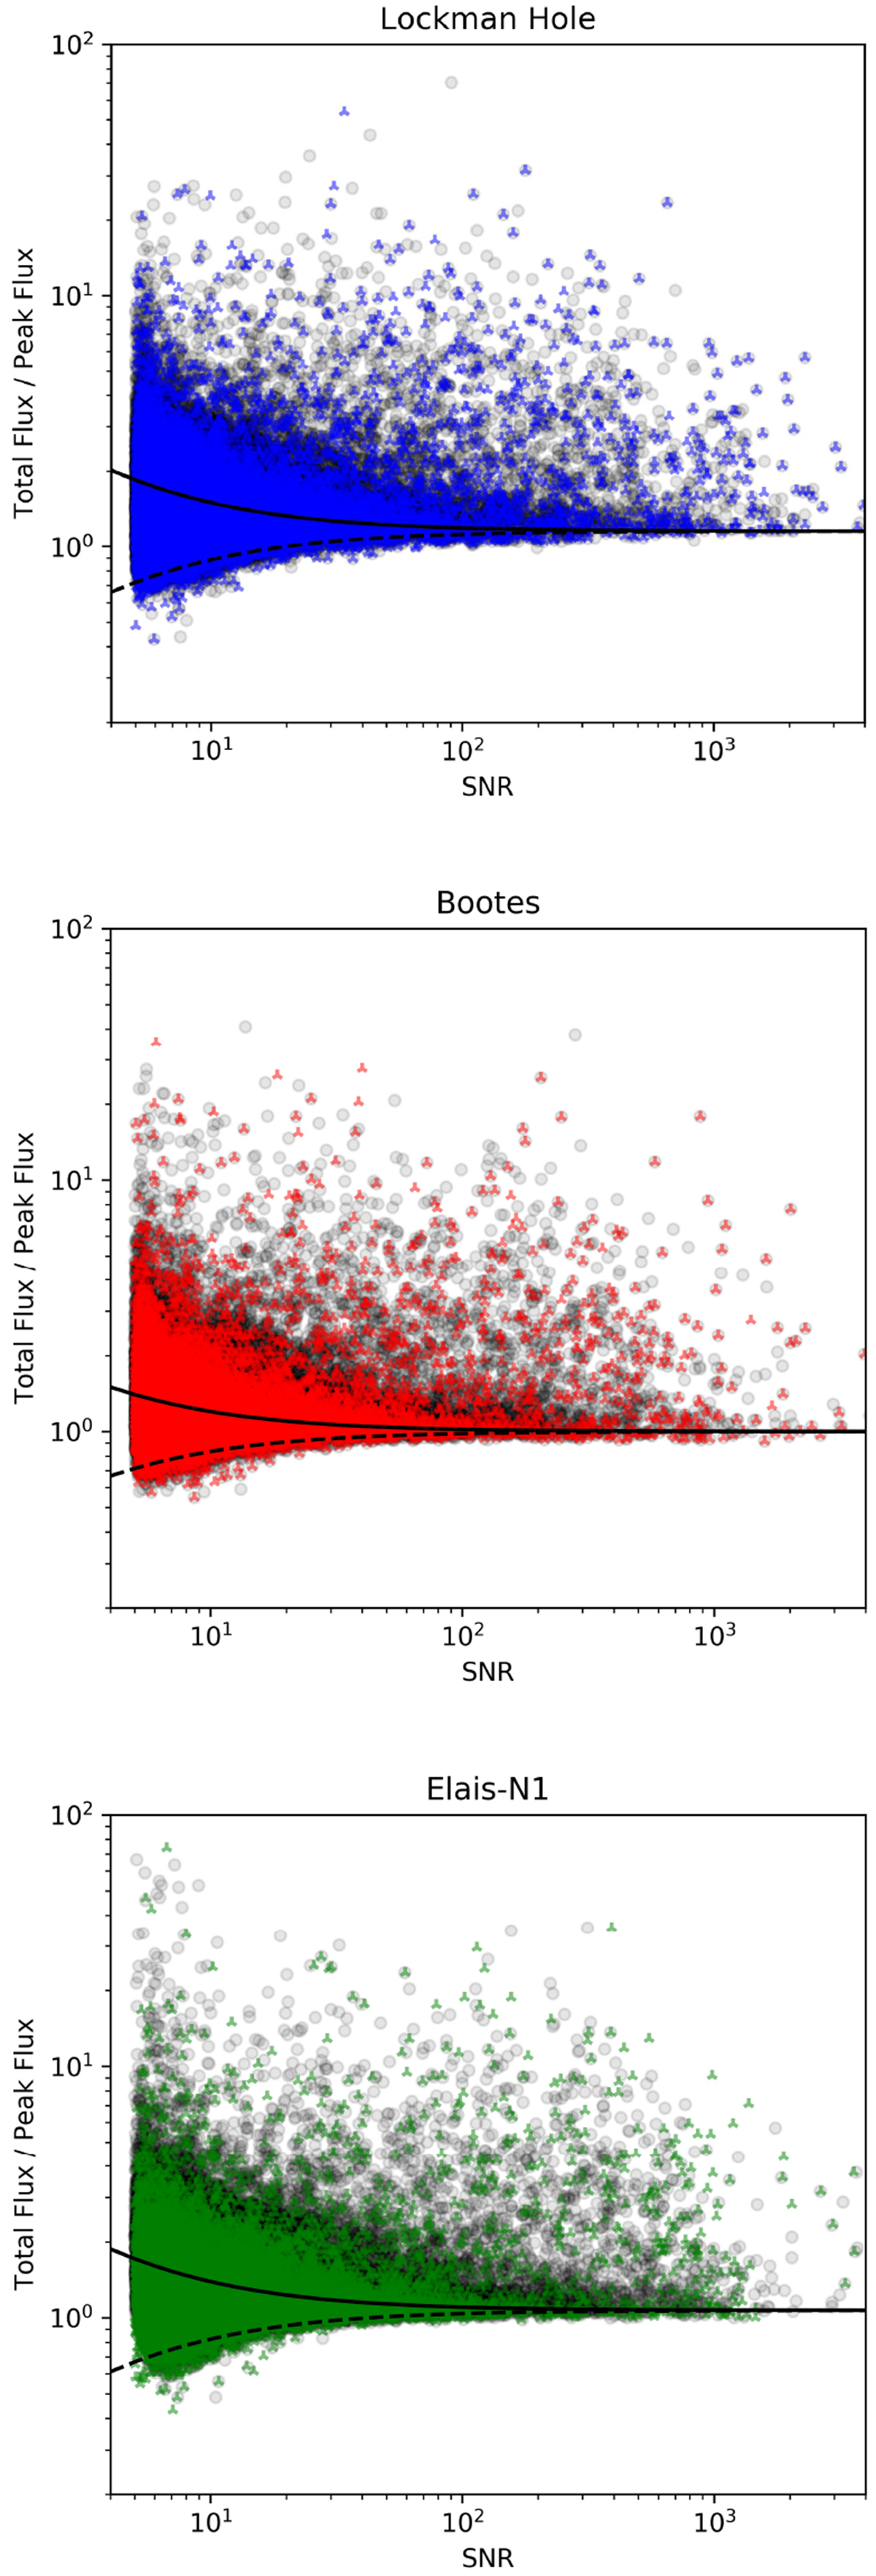
Total to peak flux density ratio as a function of signal to noise ratio (S∕N = Speak∕σ) for both theraw (black transparent circles) and final ![]() symbols in blue, red and green colors) catalogs in the LH, Boo and EN1 fields (respectively from top to bottom panels). The dashed and solid lines represent the unresolved source distribution lower and upper envelopes respectively (see text for more details).
symbols in blue, red and green colors) catalogs in the LH, Boo and EN1 fields (respectively from top to bottom panels). The dashed and solid lines represent the unresolved source distribution lower and upper envelopes respectively (see text for more details).
Current usage metrics show cumulative count of Article Views (full-text article views including HTML views, PDF and ePub downloads, according to the available data) and Abstracts Views on Vision4Press platform.
Data correspond to usage on the plateform after 2015. The current usage metrics is available 48-96 hours after online publication and is updated daily on week days.
Initial download of the metrics may take a while.