Fig. 11
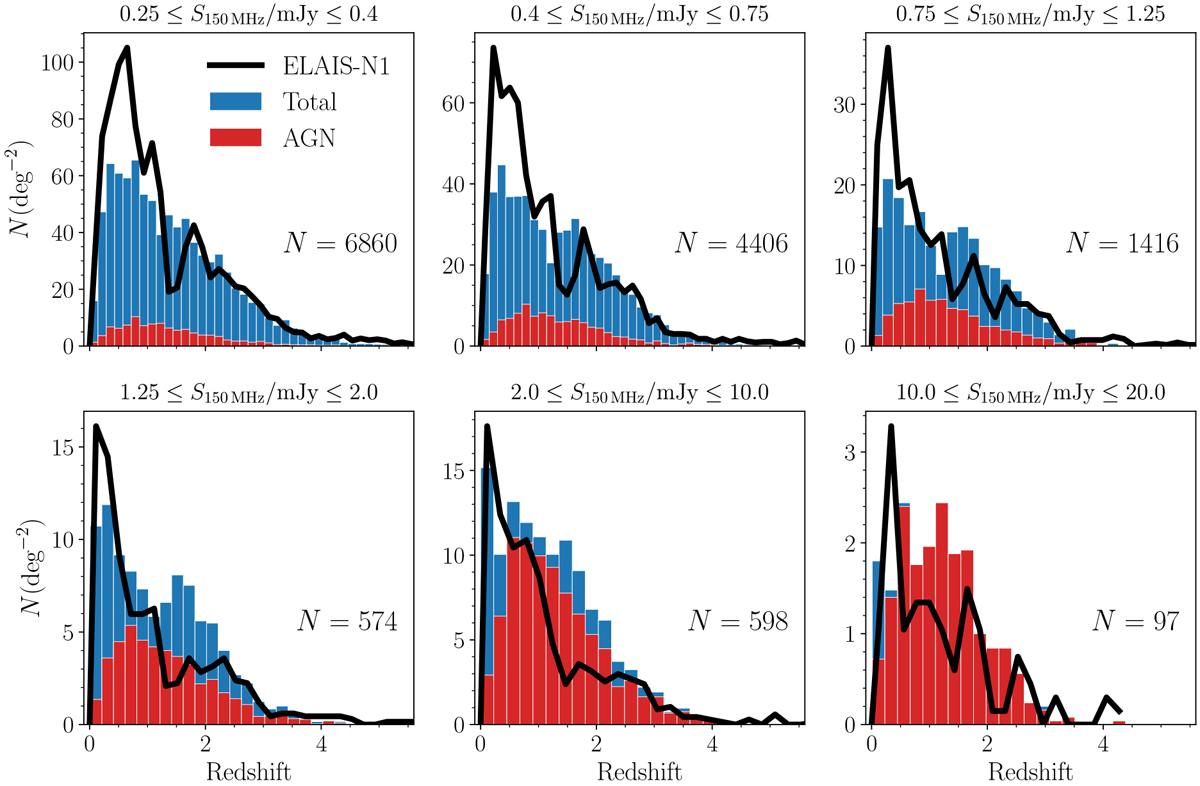
Redshift distribution of the simulated sources in Bonaldi et al. (2019) catalog: the blue histogram corresponds to the total number of sources; the red histogram corresponds to the AGN component only. The solid black line shows the redshift distribution of the sources in the EN1 field. For a proper comparison the y-axis represents the source density in each catalog. Each panel corresponds to a different flux density bin, increasing from left to right and from top to bottom. Redshift bins range from Δz = 0.14 to Δz = 0.22 from the faintest to the brightest flux bin, i.e., they are larger than the estimated photometric redshift scatter by a factor 2− 3 for AGN andby a factor ≥7 for galaxies. We caution that the EN1 redshift distributions are reliable only up to z ~ 1.5 for galaxies and up to z ~ 4 for AGN.
Current usage metrics show cumulative count of Article Views (full-text article views including HTML views, PDF and ePub downloads, according to the available data) and Abstracts Views on Vision4Press platform.
Data correspond to usage on the plateform after 2015. The current usage metrics is available 48-96 hours after online publication and is updated daily on week days.
Initial download of the metrics may take a while.