Fig. 10
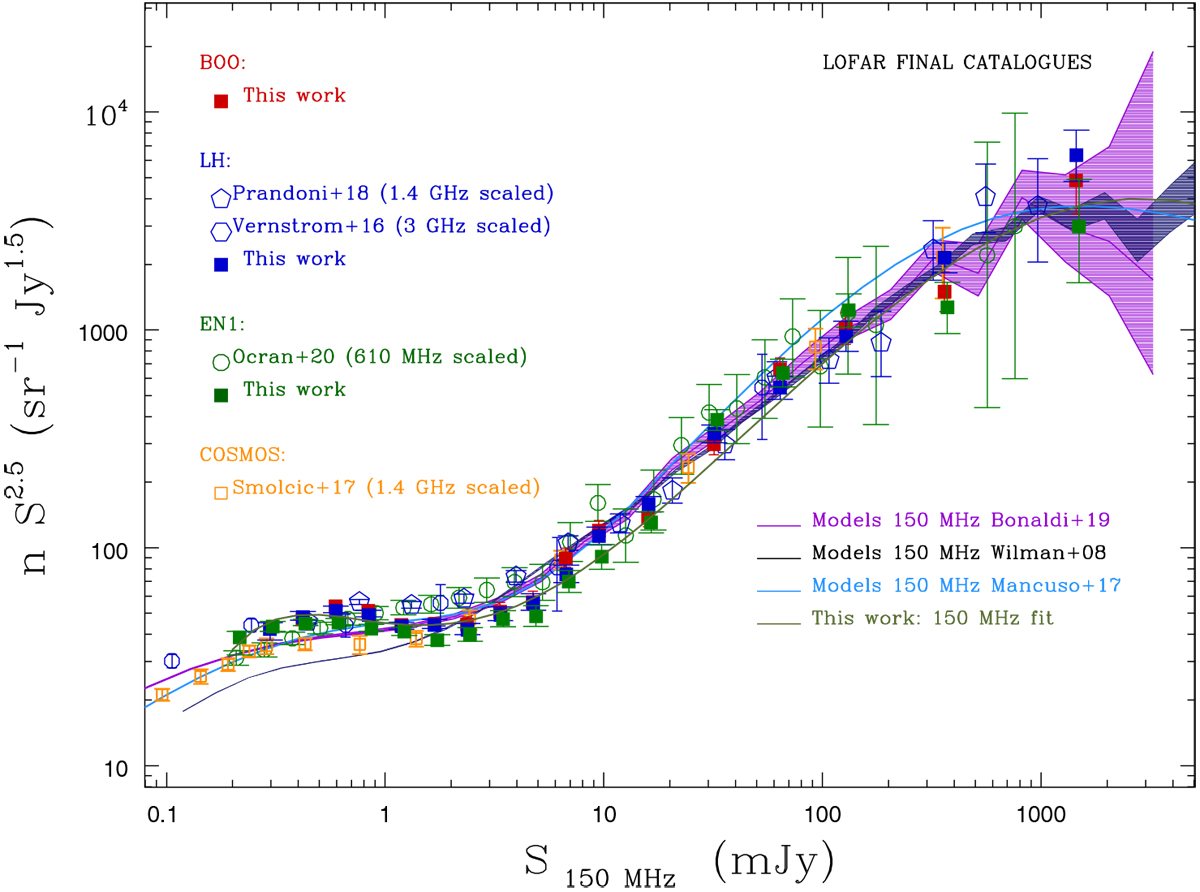
Normalized 150 MHz differential source counts in the three LoTSS Deep Fields, as derived from final catalogs (filled squares), together with their best fit (gray solid line). They are compared to counts derived from higher frequencies surveys (see legend), and rescaled to 150 MHz by assuming α = − 0.7. Error bars correspond to the quadratic sum of Poisson and systematic errors. Also shown are the Wilman et al. (2008), Bonaldi et al. (2019) and Mancuso et al. (2017) 150 MHz models. The counts are derived by using total flux densities for both point and extended sources.
Current usage metrics show cumulative count of Article Views (full-text article views including HTML views, PDF and ePub downloads, according to the available data) and Abstracts Views on Vision4Press platform.
Data correspond to usage on the plateform after 2015. The current usage metrics is available 48-96 hours after online publication and is updated daily on week days.
Initial download of the metrics may take a while.