Fig. 1
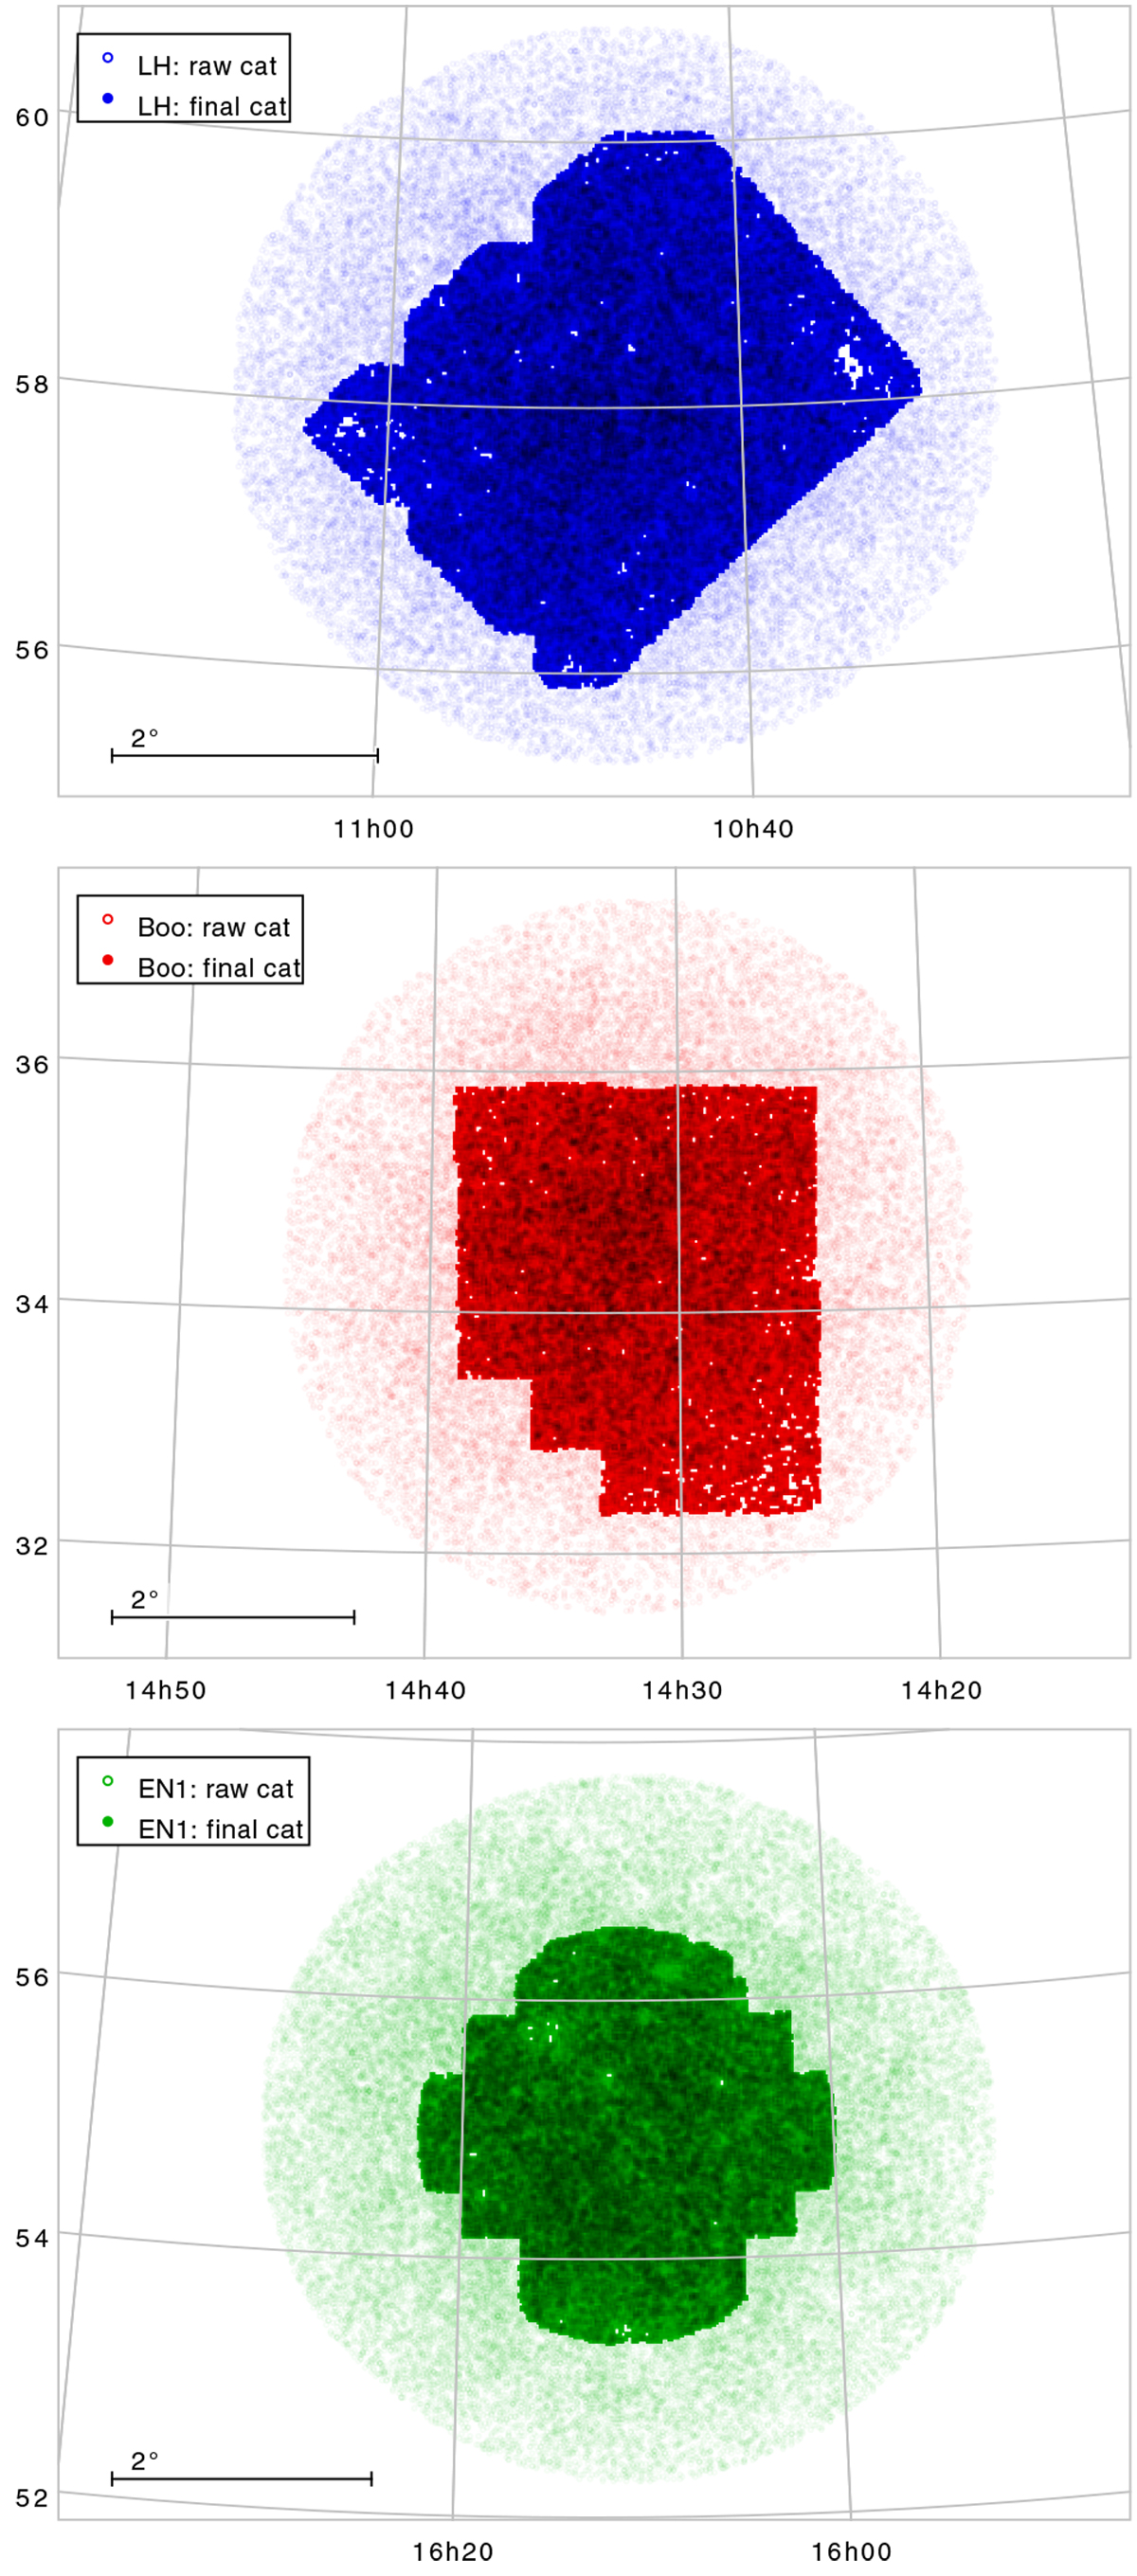
LH (top), Boo (middle) and EN1 (bottom) fields targeted by LOFAR at 150 MHz. Light colors refer to the raw catalogs, cut at a distance from the pointing center of 0.3 of the LOFAR 150 MHz primary beam power. Darker colors refer to the final catalogs. The varying shape of their footprints highlights the regions with available optical/IR data. The areas of the optical/IR footprints are listed in Table 1.
Current usage metrics show cumulative count of Article Views (full-text article views including HTML views, PDF and ePub downloads, according to the available data) and Abstracts Views on Vision4Press platform.
Data correspond to usage on the plateform after 2015. The current usage metrics is available 48-96 hours after online publication and is updated daily on week days.
Initial download of the metrics may take a while.