Fig. 10
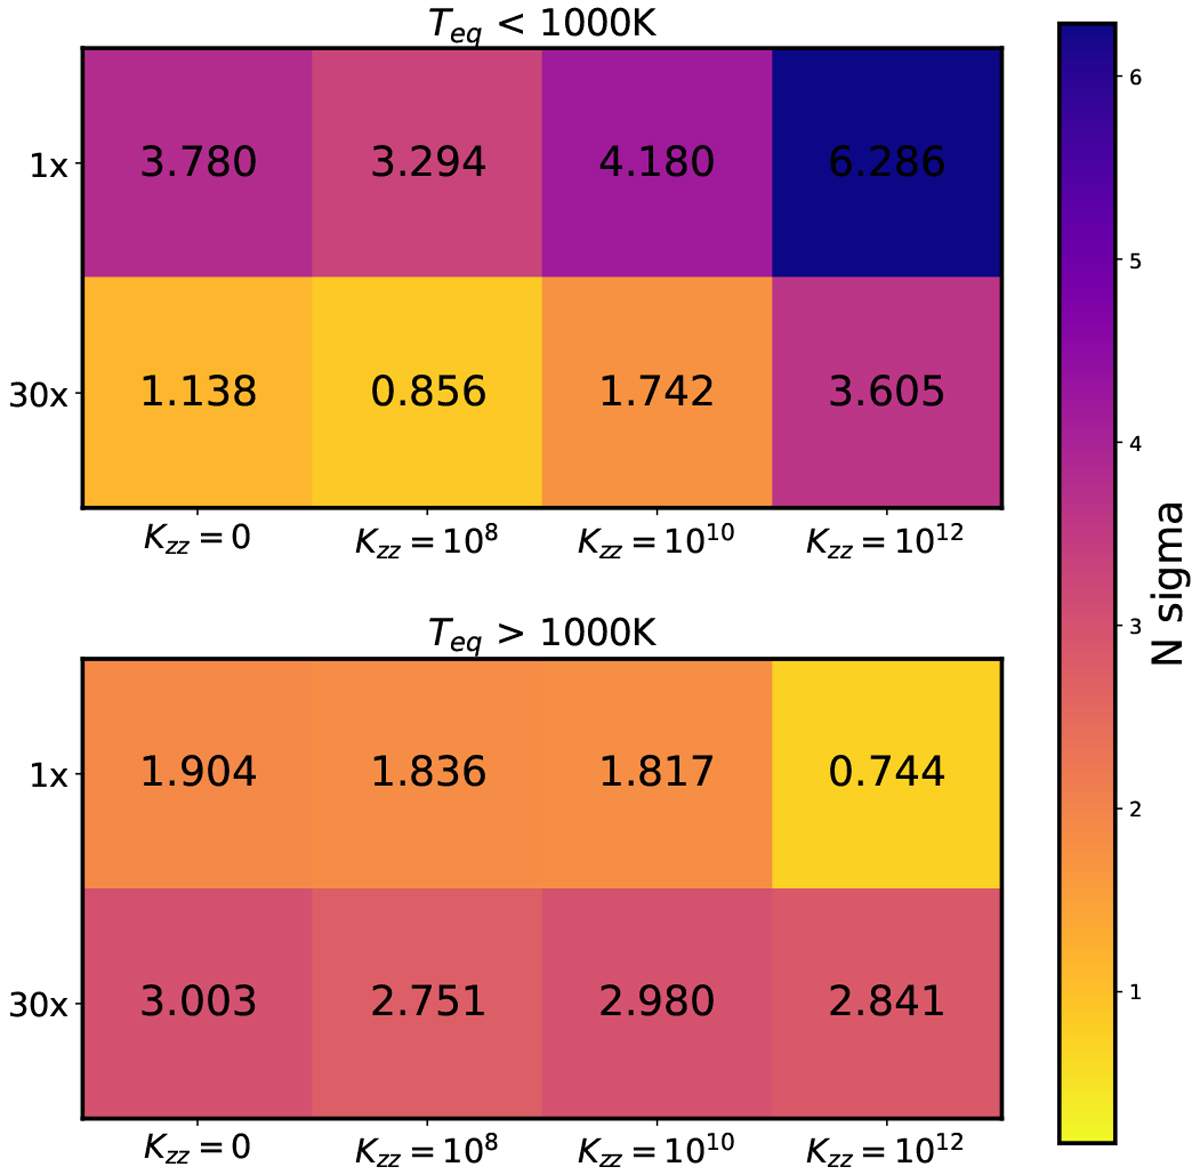
Number of sigmas between the data and each model grid. We do this for eight grids and three sets or subsets of planets. The eight model grids are composed of two different metalicities (1x and 30x Solar) and four different vertical mixing scenarios (Kzz =0, 108, 1010 and 1012 cm2 s−1). The color bar represents the average number of sigmas between each model grid and the set of data; a lower N sigma (yellow) means a better fit. The top panel shows the results for the cool planets (Teq < 1000 K) and the bottom panel shows the hot planets (Teq > 1000 K). The numberof sigmas is written on each cell.
Current usage metrics show cumulative count of Article Views (full-text article views including HTML views, PDF and ePub downloads, according to the available data) and Abstracts Views on Vision4Press platform.
Data correspond to usage on the plateform after 2015. The current usage metrics is available 48-96 hours after online publication and is updated daily on week days.
Initial download of the metrics may take a while.