Fig. 8
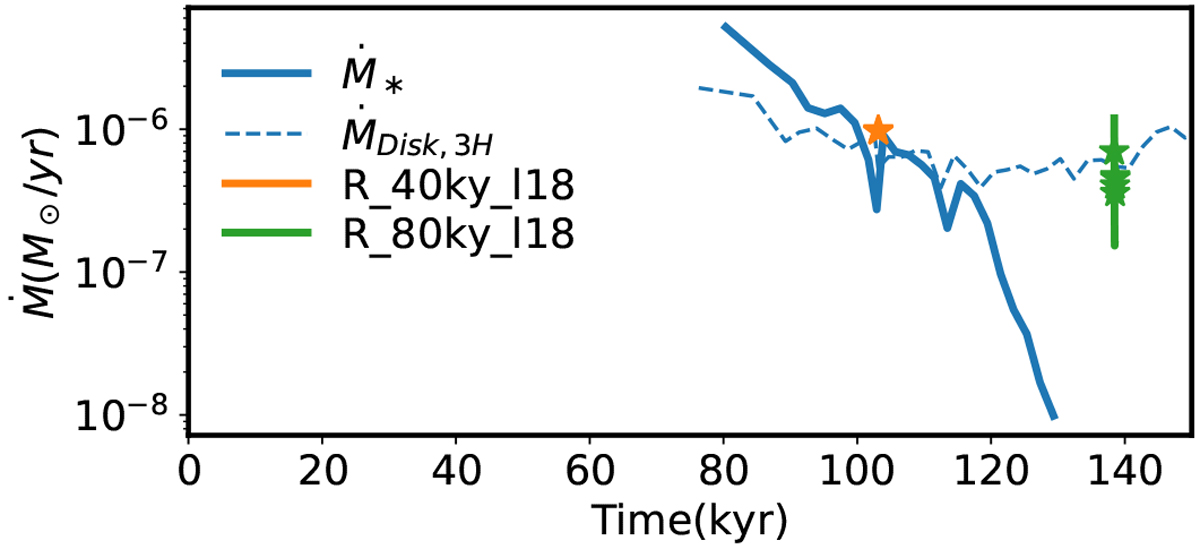
Mass accretion rate evolution. The canonical run at 1 AU resolution is plotted in blue. The mass accretion rate of the sink particle (thick line) is derived directly from its mass evolution. The accretion rate onto the disk is the integral of the measured source function (dashed line, as described in Sect. 5.5.3). The mass accretion rate is initially high an decreases slowly with time. The mass accretion onto the sink particle, though generally decreasing in time, shows some bursty behavior. This is due to the accumulation at the inner disk border shortly before reaching the accretion threshold. After 130 kyr, the density of the disk drops so much such that the threshold density of the sink accretion algorithm is no longer met and the sink hardly accretes. The high-resolution restarts are overplotted (solid line for sink accretion and stars for disk surface accretion). The mass flux onto the disk surface is unchanged in general, while the sink accretion is sensitive to the inner boundary condition of the disk (i.e., the choice of nacc, see Sect. 3.3).
Current usage metrics show cumulative count of Article Views (full-text article views including HTML views, PDF and ePub downloads, according to the available data) and Abstracts Views on Vision4Press platform.
Data correspond to usage on the plateform after 2015. The current usage metrics is available 48-96 hours after online publication and is updated daily on week days.
Initial download of the metrics may take a while.